1. Understanding Lodging Business
① Definition of Lodging Business
The term ‘lodging business’ is used with various implications in Korea. It sometimes means lodging business implicating an activity of supplying lodging products to the market, sometimes means lodging enterprise implicating the subject of such activities, and sometimes means lodging industry implicating the entire set of them. This ambiguity often causes misinterpretation of relevant regulations and statistics, which may eventually grow to larger problems that cannot be resolved straightforwardly.
② Elements of Lodging Business
Lodging business means an activity of providing a place together with services on a daily basis for people to stay temporarily away from home. In other words, its starting points are a lodging property in a broad sense and a lodging enterprise producing and providing services out of it. A lodging property in a broad sense means any property used for a lodging business, while a lodging business in a narrow sense is a property permitted only for lodging business pursuant to the Building Act. For example, a single-family house used as a rural minbak is not a lodging property in a narrow sense but a lodging property in a broad sense.
③ Split between Ownership and Operations
Traditionally, a lodging enterprise was the owner of the lodging property, and there was not much need to view them separately. However, lodging enterprises started to diverge from ownership of lodging properties, along with changing competitive environment in the lodging industry. The key driver was the need for isolating two different cycles in capital management, working against each other: the owner of a lodging property wanted to maximize capital gain on a long-term basis, while the lodging enterprise needed to maximize operating profit on a short-term basis.
2. Interpreting the Report
① Definition of Lodging Establishment
A lodging establishment means a minimum set of assets to produce and distribute lodging products independently, based on a combination of a lodging property and a lodging enterprise. The concept is built upon the many-to-many relationship between lodging properties and lodging enterprises, which became prevalent along with split of ownership and operations. For example, the number of lodging establishments is equal to the number of lodging enterprises, if multiple lodging enterprises run lodging businesses independently in a lodging property. On the other hand, the number of lodging establishments is equal to the number of lodging properties, if a lodging enterprise operates multiple lodging properties separately at different locations.
② Classification of Supply
This report uses the Establishment Types as the classification system of supply, which incorporates the classification systems of lodging establishment types pursuant to individual regulations, building types of lodging properties pursuant to the Building Act, and business types of lodging enterprises pursuant to the Business Type Code. As such, the data for lodging establishments are classified and compiled into tourist hotels, other hotels, resort condos, general lodgings, residential lodgings, rural minbaks, urban minbaks and other lodgings.
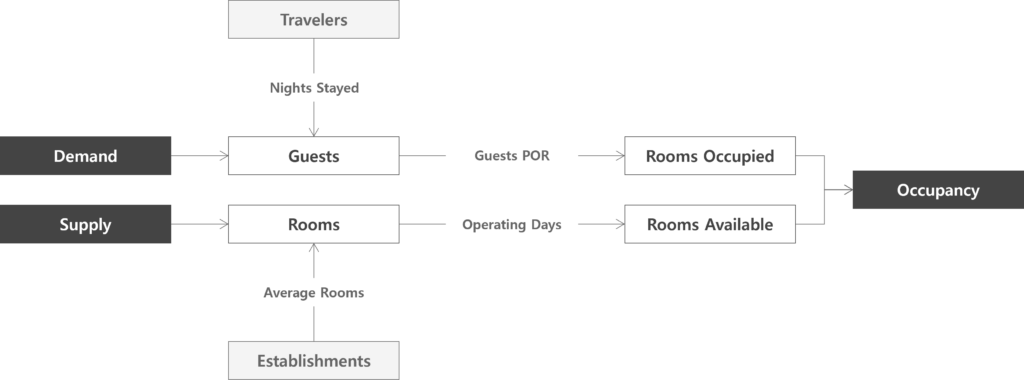
③ Measurement of Supply
The number of establishments, the number of rooms and the number of rooms available are the major indicators of supply volume. The number of rooms available means the total number of room products available for daily sales in a year, calculated as the number of rooms multiplied by the number of operating days in a year. Also, the average number of rooms is the indicator of scale of establishments, calculated as the number of rooms divided by the number of establishments. This report measures trends and status of supply based on the compounded annual growth rate and the fair share of supply indicators for a specified period of time.
④ Classification of Demand
The lodging demand means guests who stay temporarily at lodging establishments away from home. The lodging demand can be broken down by various criteria, but this report breaks it down into domestic and international demands by origin, and into leisure and other demands by purpose. Moreover, they can be further broken down based on consumption patterns: by age group in the case of domestic demand, and by nationality in the case of international demand.
⑤ Measurement of Demand
The number of guests is the major indicator of demand volume, and the number of rooms occupied is the major indicator of consumption volume. However, it should be noted that they capture only accommodated demand but not all of potential demand. Also, the occupancy is the indicator of balance between supply and demand, calculated as the number of rooms occupied divided by the number of rooms available, and the number of guests per occupied room is the indicator of productivity by demand group, calculated as the number of guests divided by the number of rooms occupied. This report measures trends, status and stability of demand based on the market share and the volatility of demand indicators for a specified period of time. In this report, the volatility is calculated as the standard deviation divided by the average.
3. Sorting through the Supply
- Rural Minbak +6.8% (Share: 48%→50%)
- General Lodging -4.0% (Share: 32%→30%)
- Residential Lodging +12.0% (Share: 12%→13%)
- General Lodging -3.8% (Share: 44%→42%)
① Diversification of Establishment Types
The number of lodging establishments in Korea increased by 3.8% per annum, from 33 thousand in 2005 to 63 thousand in 2023. Especially, the increase has been notable for relatively new types such as rural minbak, urban minbak and residential lodging, while general lodging, which has accounted for the largest share, has continuously decreased. This trend continued in 2023, when urban minbaks increased the most by 26.1%, followed by residential lodgings of 10.4% and rural minbaks of 6.8%. However, general lodgings decreased by 4.0%.
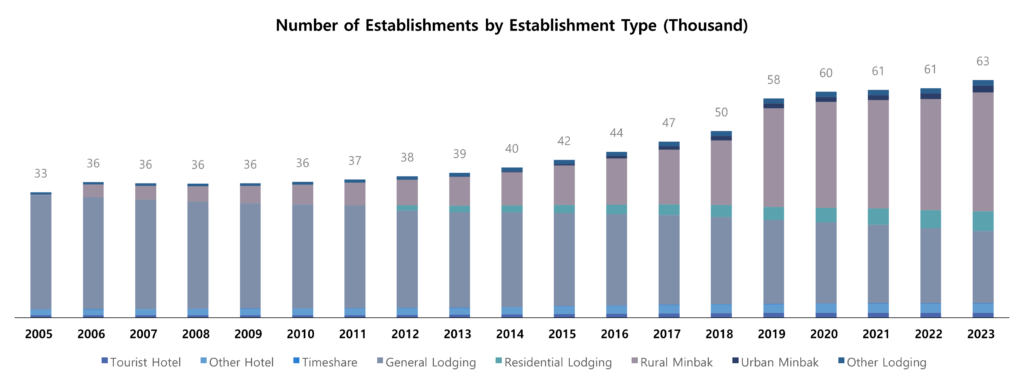
The supply of rural minbaks has been growing constantly since it began to be captured in public statistics at the end of 2005 upon shift of its business registration system from reporting basis to approval basis. The supply of urban minbaks began to be captured in public statistics upon legislation at the end of 2011, and the supply of residential lodgings did upon separation from the general lodging at the beginning of 2012.
The number of hotels has increased continuously despite its high entry barrier, as some of non-hotel establishments were incorporated into the hotel upon addition of new sub-types under the hotel. The hostel was created in 2009, and the small hotel and the medical hotel were created in 2014 as sub-types of the hotel.
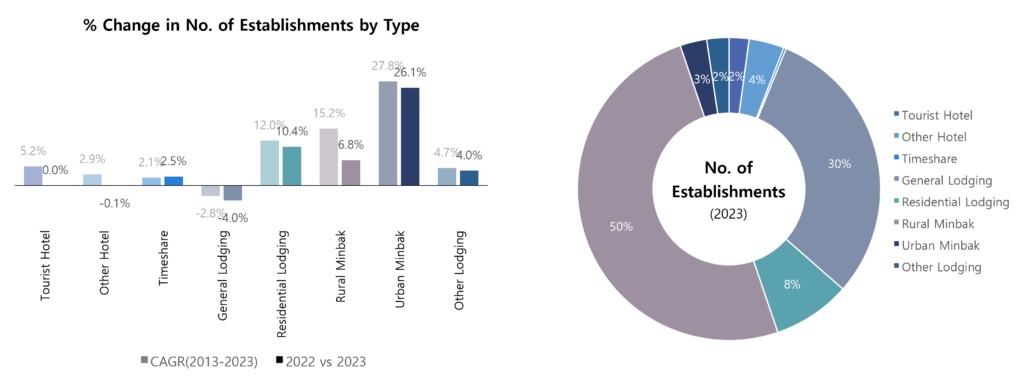
As of 2023, the rural minbak accounted for the largest share of 50% in the number of establishments, followed by the general lodging with 30% share and the residential lodging with 8% share. The share of rural minbak increased by 2 percentage points from 48% in 2022 to 50% in 2023, while that of general lodging decreased by 2 percentage points from 32% to 30%.
The number of rooms increased by 1.5% per annum, from 754 thousand in 2005 to 979 thousand in 2023. Despite the continuous increase, the magnitude was significantly lower than that of establishments, 3.6% per annum. It is because the most increase of establishments occurred in segments of smaller room count such as rural minbaks and urban minbaks.
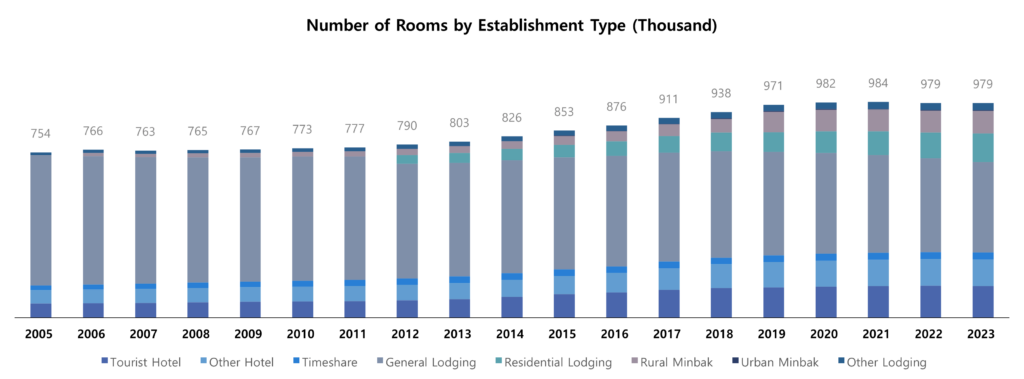
The rural minbak and the urban minbak should use a single-family house or a multi-family housing unit, instead of a lodging property, and the lodging business must be a side line. Also, the floor area used for dwelling and lodging business combined is not allowed to exceed 230㎡ by regulation.
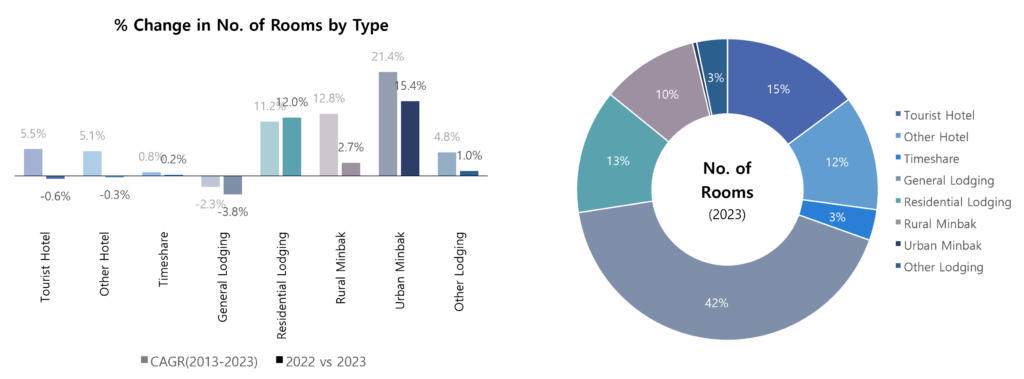
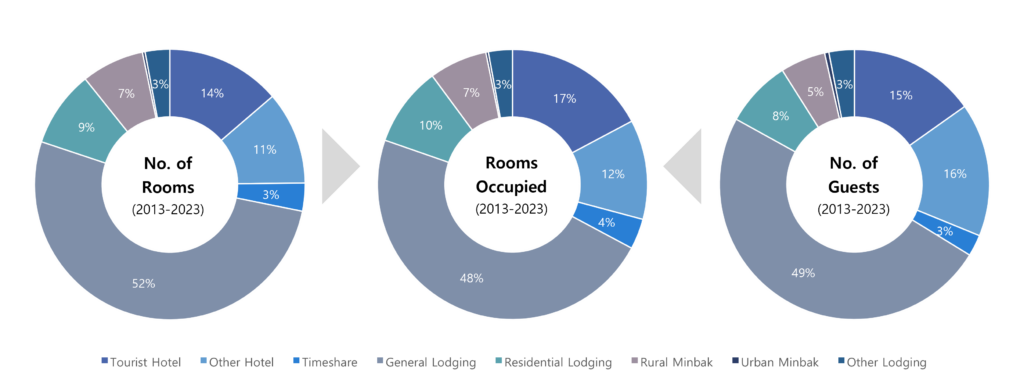
As of 2023, the general lodging accounted for the largest share of 42% in the number of rooms, followed by the tourist hotel with 15% share, the residential lodging with 13% share and the other hotel with 12% share each. The share of general lodgings decreased from 44% in 2022 to 42% in 2023, while that of residential lodgings increased from 12% to 13%.
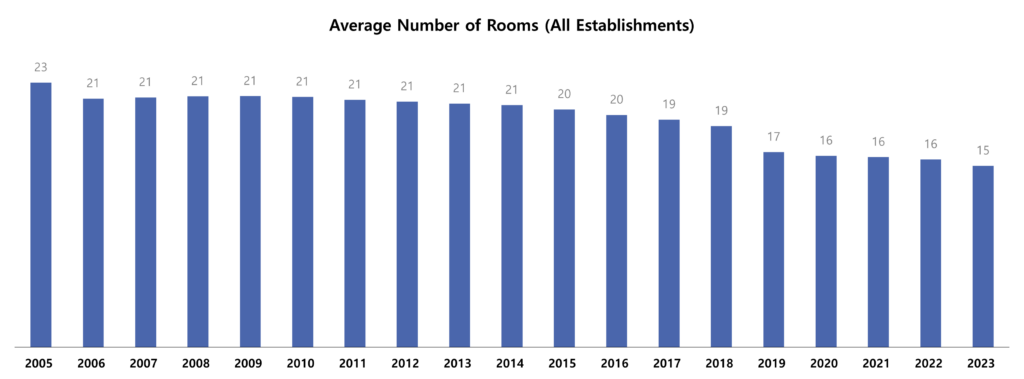
② Downsizing of Establishments
Downsizing spread across the entire lodging industry along with the rapid increase of small lodging establishments with the statutory size limit. The average number of rooms of lodging establishments decreased by 2.1% per annum from 23 in 2005 to 15 in 2023.
The average number of rooms of rural minbaks, which has played the key role in downsizing across the lodging industry, expedited self-downsizing even further through the decrease by 2.1% per annum from 2013 to 2023 with 3.8% decrease in 2023. The residential lodgings has been gradually downsizing in themselves as well with a decrease in the average number of rooms by 1.3% per annum from 2013 to 2023, while its number of rooms increased by 11.2% per annum. However, the pace of self-downsizing slowed down in 2023 with an increase in the average number of rooms by 1.5%.
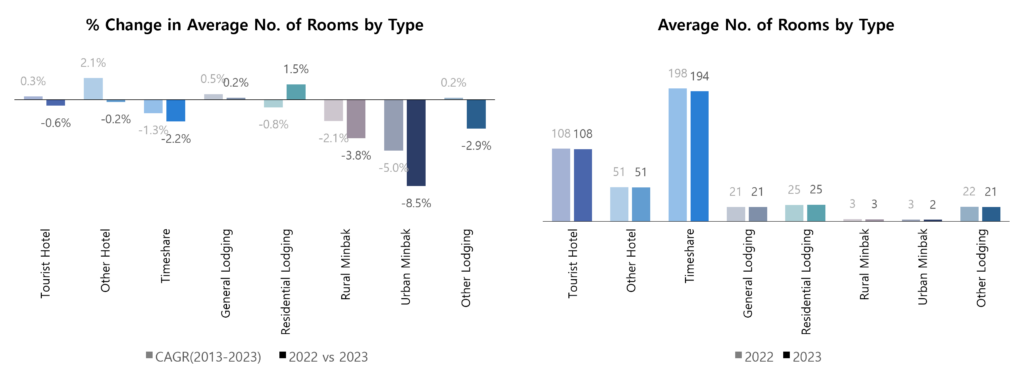
As of 2023, the largest type of establishment was the resort condo with the average number of rooms of 194, followed by the tourist hotel with 108 rooms and the other hotel with 51 rooms.
Although the average number of rooms of the resort condo has decreased by 1.3% per annum since 2013, it is still the largest type of establishment as compared to the others. However, it decreased more than before in 2023 by 2.2%. On the other hand, the average number of rooms of the other hotel was 51, bringing it into the large unit-size group, was the outcome of continuous increase in the average number of rooms by 2.1% per annum since 2013.
The smallest type of establishment was the urban minbak with the average number of rooms of 2, followed by the rural minbak with 3 rooms. In particular, urban minbaks seemed to expedite self-downsizing in 2023 with 8.5% decrease in the average number of rooms, which is attributable to shift of its configuration from a guesthouse style to a shared lodging style.
4. Sorting through the Demand
- Over 60 +22.8% (Share: 16%→20%)
- 20's -9.9% (Share: 20%→18%)
- China +224.3% (Share: 22%→41%)
- USA -22.7% (Share: 30%→14%)
① Domestic Leisure Market
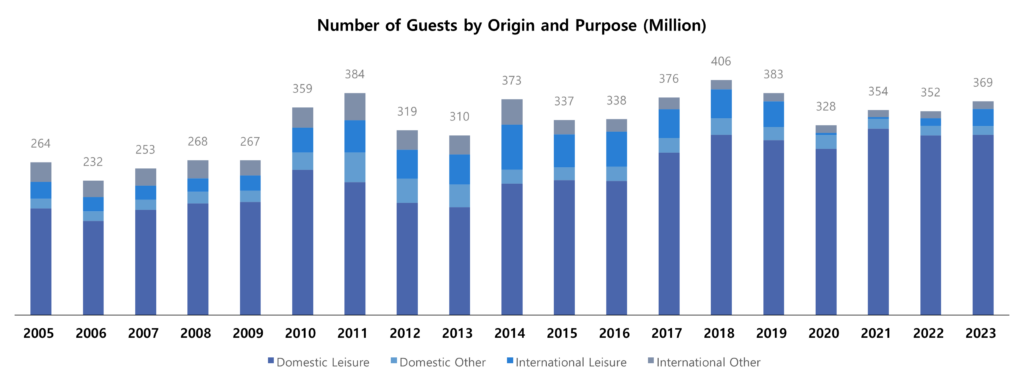
Domestic leisure demand has supplied the largest volume to the lodging market of Korea, on a stable basis. It accounted for 73% of total number of guests from 2005 to 2023, with the lowest volatility of 22.1% among 4 demand segments.
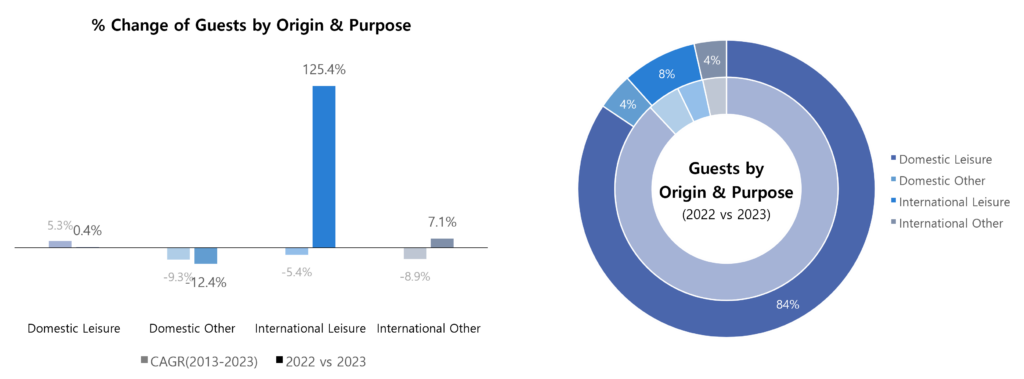
However, the domestic leisure demand increased marginally by 0.4% in 2023, bringing down the share of guests from 88% to 84%. It is attributable to the increase of outbound travels by domestic travelers.
Most regions in Korea fall under the one-day living zone, due to the small territory with a sophisticated transportation system. As such, there are not many domestic business travelers, and leisure travelers account for majority of domestic demand, with concentration in vacation seasons. In other words, domestic demand demonstrates a high degree of seasonality, which often results in a low level of annual occupancy.
From 2005 to 2023, international leisure demand accounted for 11% of total number of guests for the same period of time, but with the high volatility of 53.3%. The international leisure demand, which disappeared upon outbreak of COVID-19, increased by 12.4% in 2023, bringing up the share of total guests from 4% to 8%.
Nevertheless, the consumption price is generally higher for international demand than for domestic demand across most countries, and the operating profit of lodging establishments is likely to be higher with more international demand. However, the heavy reliance on international demand is accompanied by increased need for working capital to secure stability of cash flows, due to the volatility brought up by international demand.
② General Lodgings for Domestic Demand
Generally, domestic demand is impacted much by internal factors, such as income, inflation and interest rate, but not as much by external factors, such as exchange rates, pandemic and international politics. In fact, there was not much of meaningful chage in domestic demand when the global financial crisis spread throughout the world in 2009, when MERS flew into Korea in 2015, and when COVID-19 brought the entire world to standstill in 2020.
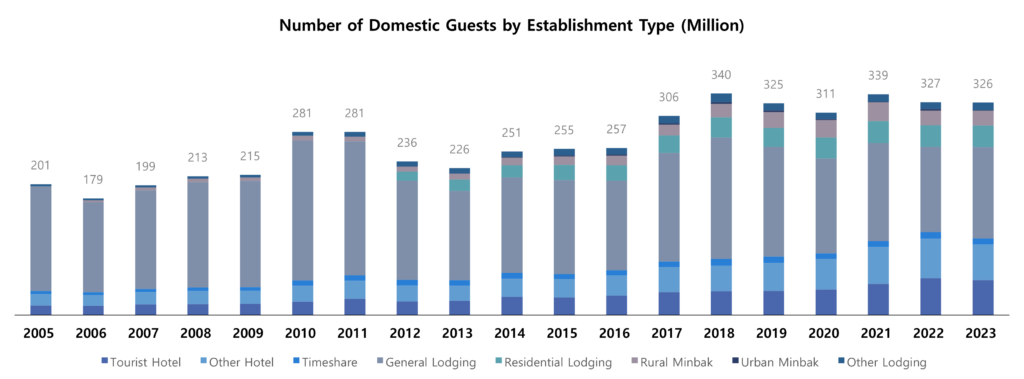
The consumption pattern of domestic demand typically traced the supply mix. From 2013 to 2023, the general lodging, which supplied the most rooms, took the most domestic guests with 51% share, while the urban minbak, which supplied the least rooms, took the least domestic guests.
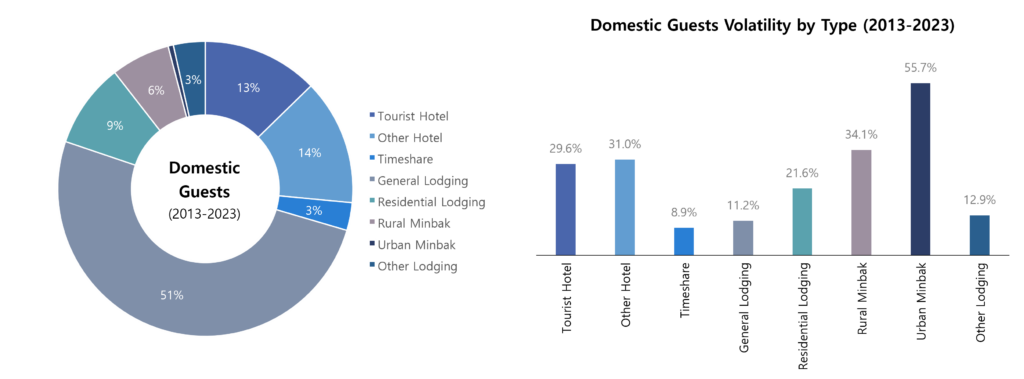
During the period, domestic demand was the most stable at resort condos with the volatility of 8.9%, while it was the least stable at urban minbaks with the volatility of 55.7%. For the other types, the volatility was low at general lodgings, residential lodgings and other lodgings, while high at rural minbaks, tourist hotels and other hotels.
③ 2023, Return of Elderly
The most notable feature of domestic demand in 2023 is the recovery of demand from the elderly population over 60 to pre-pandemic levels after being extremely suppressed during COVID-19. Additionally, the demand from the youth in their 20s went back down to pre-pandemic levels, who had driven the lodging market in Korea during the pandemic.
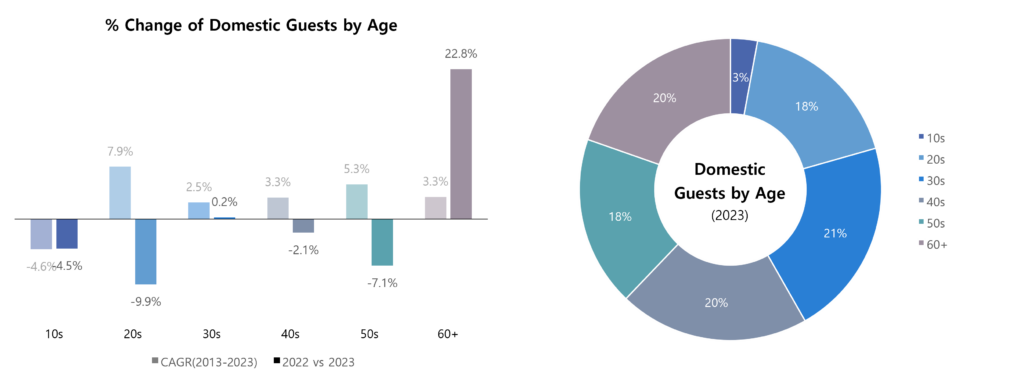
In 2019, people over 60 accounted for 18% of domestic guests while people in their 20s accounted for 20%. In 2021, the shares diverged as 12% for over 60 and 23% for 20s. In 2023, the shares were reversed as 20% for over 60 and 18% for 20s. In 2023, the number of guests over 60 increased by 22.8%, while the number of guests in 20s decreased by 9.9%. It is because the elderly came back to the lodging market late due to concerns about health while 20s started to go out upon opening of borders.
④ Hotels for International Demand
On the other hand, international demand is impacted significantly by external factors, such as exchange rate, pandemic and international politics. Also, the impact of income, inflation and interest rate by country applies more complicatedly, as the international demand is composed of guests from various countries. Therefore, its volatility is much higher than that of domestic demand. For example, Japanese guests increased rapidly from 2009 to 2012 due to the appreciation of JPY, but decreased rapidly from 2013 due to the depreciation of JPY. On the other hand, Chinese guests increased explosively from 2013 to 2014 due to the spread of Korean Wave, but disappeared following MERS in 2015 and the ban on Korean culture triggered by THAAD deployment in 2016.
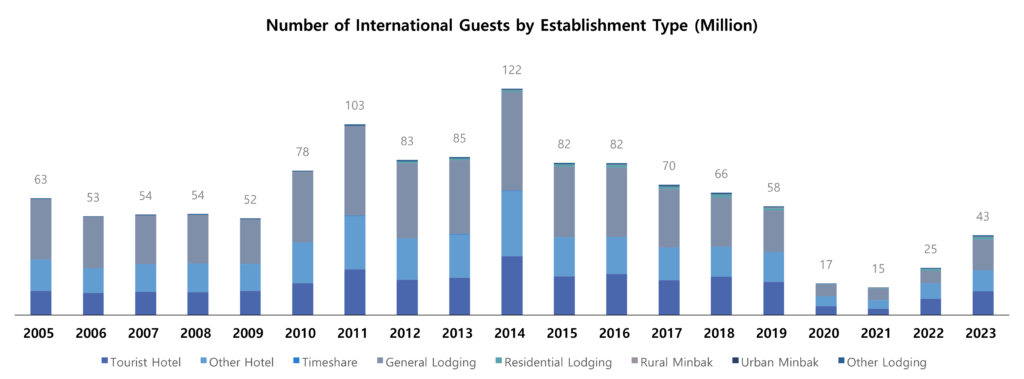
International demand tended to prefer hotels, the unit size of which is relatively large. From 2013 to 2022, tourist hotels and other hotels absorbed 54% of international guests, while relatively small-scale rural minbaks, urban minbaks, and other lodgings had negligible shares.
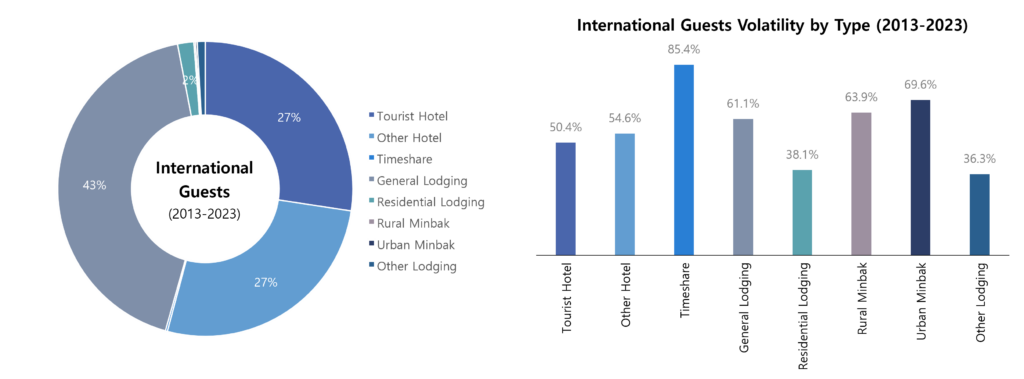
During the period, excluding rural minbaks, urban minbaks and other lodgings with negligible shares in absorbing international guests, the international demand was the most stable at residential lodgings with the volatility of 38.1%, while it was the least stable at resort condos with the volatility of 85.4%. The reason for difference in volatilities between 2012-2022 period and 2013-2023 period is because the period impacted by pandemic is longer for 2013-2023 period, which amplified the volatility.
⑤ 2023, Return of Chinese
The most notable feature of international demand in 2023 is the recovery of visitors from China, Japan, Taiwan, and Hong Kong to pre-pandemic levels, after having disappeared during COVID-19. Additionally, there has been a significant decrease in the number of visitors from USA, who were the first to come back to Korea immediately after the pandemic.
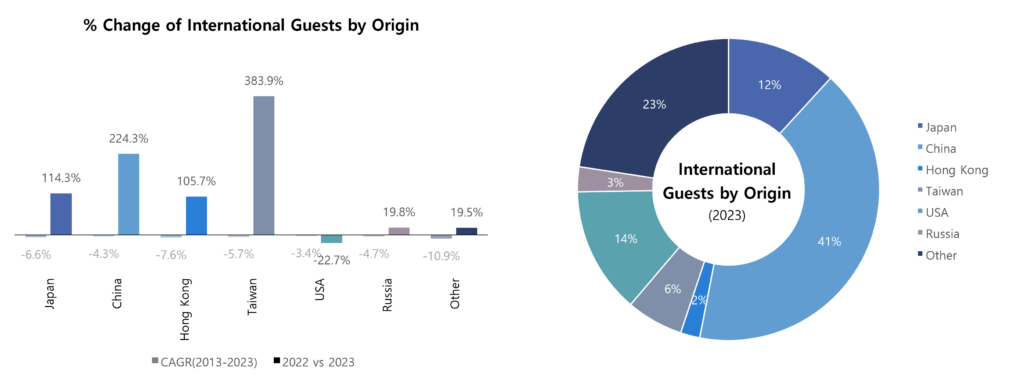
The share of international guests in 2019 was 35% for Chinese, 11% for Japanese and 10% for Americans. The share became meaningless in 2020, when the borders were closed down, and reinstated in 2022, when the borders opened up again. In 2022, Americans demonstrated the fastest recovery with 30% share in international guests, while Chinese stayed at 22% and Japanese did at 9%. In 2023, Chinese came back up to 41%, Americans to 14% and Japanese to 12% shares, close to the level before the pandemic.
5. Balancing Supply and Demand
- General Lodging +12.3% (Share: 40%→42%)
- Other Hotel -0.3% (Share: 15%→14%)
- General Lodging 43%→49%
- Tourist Hotel 61%→65%
- Urban Minbak 44%→35%
In the lodging market, the asymmetry of supply and demand can be observed in the difference in shares between the number of rooms and the number of guests by lodging establishment. The general lodging supplied 52% of rooms from 2013 to 2023, and absorbed 49% of guests. During the period, the hotel supplied 25% of rooms, and absorbed 31% of guests. In other words, there were more supply than demand for general lodgings, while there were more demand than supply for hotels.
The lodging market always figures out a compromising point of asymmetric supply and demand. The number of rooms occupied is the indicator of the compromising point in volume, and used as the basis for measuring the market share.
The hotel, which supplied 25% of rooms and absorbed 31% of guests, accounted for 29% of rooms occupied from 2013 to 2023. The demand share was higher than the supply share for hotels, and the consumption volume was between them, compromising the difference.
On the other hand, the general lodging, which accounted for 52% of rooms and 49% of guests, sold 48% of rooms occupied in the market. It should be noted that the consumption volume of general lodging, which accounted for the largest market share in Korea, was smaller than both of its supply share and demand share. This happens when the supply is concentrated unevenly, meaning that general lodgings are located together in certain areas than spread out along their demand.
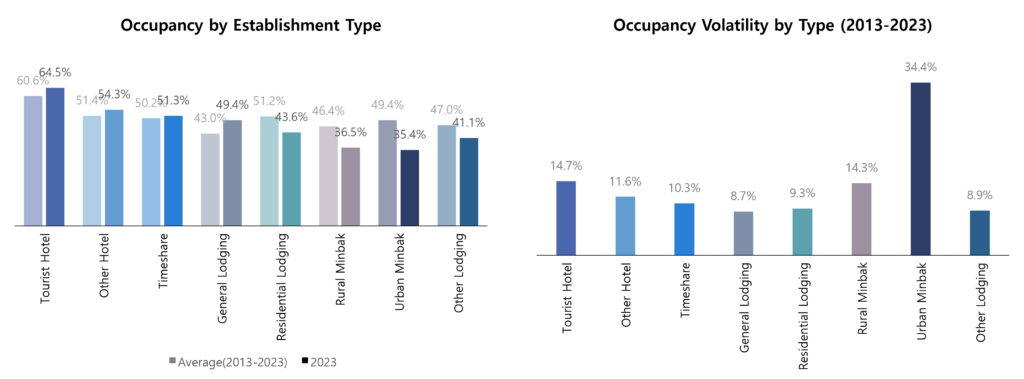
The occupancy is the indicator of the compromising point presented as a ratio to supply volume, and used as the basis for measuring balance between supply and demand. A high occupancy indicates an undersupply status, and a low occupancy indicates an oversupply status. From 2013 to 2023, the occupancy was highest for tourist hotels at 60.6%, and lowest for general lodgings at 43.0%. In other words, general lodgings, whose market share has been the largest, showed a sign of oversupply.
However, in 2023, the occupancy of general lodgings went up to 49.4%, while the occupancy of urban minbaks went down significantly to 35.4%. It can be interpreted as a sign of recovery for the entire lodging market in the case of general lodging, while it is an outcome of supply increase of urban minbak outpacing the recovery of the lodging market. From 2013 to 2023, the occupancy was the most stable at general lodgings with the volatility of 8.7%, and it was the least stable at urban minbaks with the volatility of 34.4%.
However the interpretation of the number of rooms occupied and the occupancy should be conducted cautiously. It is because they can be affected by asymmetric supply and demand as well as by productivity of guests. For example, the consumption patterns may differ by demand group, such as the number of guests staying in the same number of rooms. If more guests stay in the same number of rooms, the productivity of guests can be assessed less productive, while it can be assessed more productive with fewer guests.
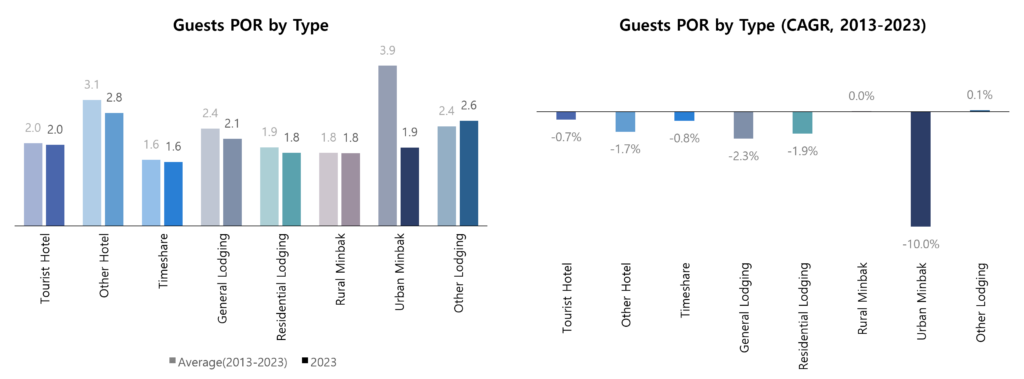
The number of guests per occupied room is the indicator to measure the productivity of guests. From 2013 to 2023, the lodging establishment with the highest productivity of guests was the resort condo with the lowest number of guests per occupied room, while the productivity of guests was lowest at the urban minbak with the highest number of guests per occupied room. However, the productivity of guests improved the most at urban minbaks with a decrease in the number of guests per occupied room by 10.0% per annum during the period.
In 2023, the most productive lodging establishment was the resort condo with the number of guests per occupied room of 1.6, followed by the rural minbak and the residential lodging. On the other hand, the number of guests per occupied room of other hotel, the second least productive next to the urban minbak from 2013 to 2023, decreased marginally to 2.8, making it a less productive establishment than the urban minbak in 2023.
Apparently, the number of guests per occupied room may be a reaction by guests to the market condition rather than a matter of their productivity. For example, more guests may stay in fewer rooms if availability of rooms is limited at a preferred type of lodging establishment for a preferred time and location, or if the price rose too much at the preferred lodging establishment and became burdensome.
6. Expanding on the Report
<a href="https://lobin.co/en/" target="_blank" rel="noopener noreferrer">Lobin Co.</a>, "<a href="https://lobin.co/en/insight/lodging-market-korea-2023/" target="_blank" rel="noopener noreferrer">Lodging Market Korea 2005-2023</a>"