1. Getting Access
- Request Access (with an email of your Microsoft account)
- Pay Annual Access Fee (currently only via Paypal Checkout)
- Accept Email Invitation (login to Microsoft account)
- Access Member Dashboard (from January 1 to December 31)
2. Use of Dashboard
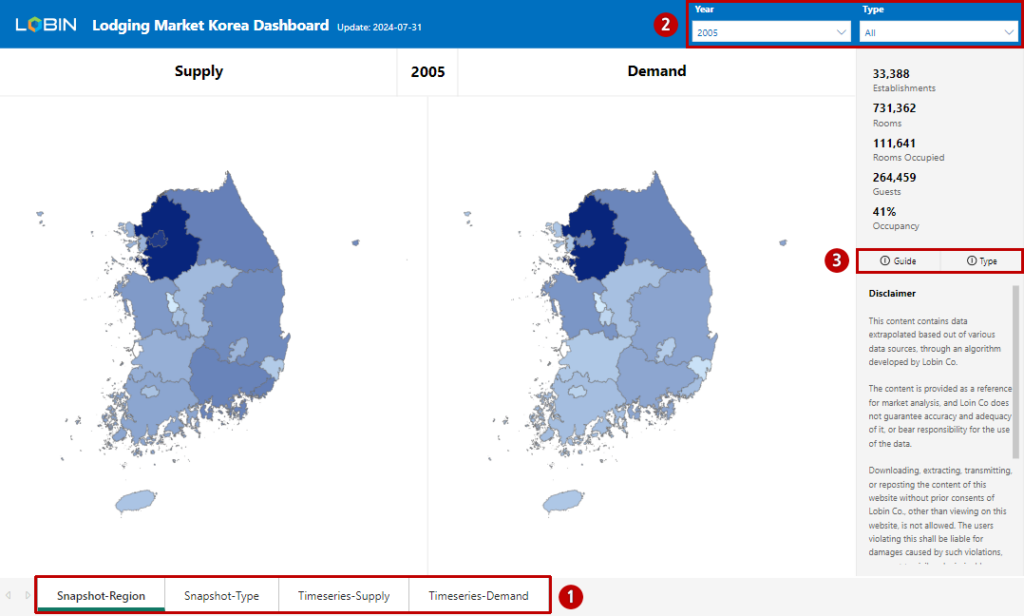
- Lobin's Member Dashboard is composed of snapshot and timeseries data, where snapshot is broken down to region and type tabs and timeseries is broken down to supply and demand tabs. Snapshot tabs allow to compare supply and demand indicators by region and type for a specific year. On the other hand, timeseries tabs allow to capture long-term patterns for each of supply and demand indicators.
- Each tab allows you to use filters to select and view data as needed. For the snapshot, year and type filters are provided, and for the timeseries, region and type filters are provided. Same-item filters are synchronized across all tabs and can be changed on each tab as well.
- If you need help in using the dashboard, you can view this document by clicking the "Guide" button on the right, and directly contact us for any inconveniences, errors and correction requests here . In addition, if you need help with the property type classification system, you can visit the "Establishment Types" page by clicking "Type" on the right.
3. Dashboard Elements
Type
Region
Type
Type
- An establishment refers to a business registered for a place, whether all or part of a building or a complex of buildings, by an operator, whether an individual or a corporation. If multiple operators operate independently in a single property, the number of establishments equals the number of operators. If an operator operates multiple properties separately, the number of establishments equals the number of properties.
- The number of rooms is the total number of rooms held by a property or properties used as a single establishment, which means the maximum number of rooms that can be sold per day. Please note that the number of rooms represents the size of the assets in which the product is produced, not the number of products itself.
- The average rooms is the average number of rooms held by establishments that correspond to the selected filter, which refers to the average number of rooms per establishment. The average rooms varies greatly depending on the establishment type, which is largely due to the regulations of the relevant laws and regulations.
- The rooms occupied is the number of room products sold in a year based on the number of rooms held by the establishment. For example, if an establishment with 120 rooms sold an average of 100 rooms per day for 365 days, the rooms occupied is 36,500.
- The number of guests is the total number of people who stayed in rooms occupied for a year. Please note that the number of guests will be counted as two if a guest stays in a room for two days.
- The guests per occupied room is the number of guests divided by the rooms occupied, which means how many people stayed on average per room occupied. The guests per occupied room is one of the productivity indicators for guests, and the smaller the value, the higher the productivity.
4. Use of Data
Snapshot outputs supply and demand indicators by region for selection years and property types on separate maps, allowing you to compare supply and demand dynamics simultaneously on a single tab. The darkness of the color marked on each map represents the supply and demand volume of accommodations corresponding to the selection filter by region, and the darker the color, the larger the volume.
Please note that the darkness of the color marked on the map is based on the relative value of each region, not the absolute value. In other words, if the color of demand is darker than that of supply for a region, it means that the share of demand is higher than the share of supply, not whether demand exceeds supply or not.
If the type is not selected on the timeseries tab, all types of data are color-coded and output. In this case, the total value of the stacked bar graph items is not provided, while the linear graph is based on the total value if the linear graphs are present together.
You can select multiple items from region and type filters on all tabs except for the year filter in the snapshot tab. When you click on the items you want to select with Ctrl key pressed, multiple items will be selected. In this case, the output data is based on the sum of the selected items.
Data cannot be downloaded and exported to other file formats such as Excel. First, we are concerned about leakage of data more than necessary due to the setup of our database, which provides a sum of individual data depending on the applied filter. Second, the functionality offered by Microsoft Power BI is not enough to control this concern. The access fee is reflective of this limitation in download/export functions.
Although not visible in the visualized objects, there are indicators that can be calculated and used directly if necessary, as following:
- Rooms Available (K): The rooms available is calculated as the number of rooms multiplied by the operating days in a year, and the occupancy is calculated by dividing the rooms occupied by the rooms available. In other words, the rooms available (K) is calculated by dividing the rooms occupied (K) by the occupancy in the Rooms Occupied graph of Timeseries-Demand tab .
- Average Operating Days: If the rooms available is calculated according to the above method, the average operating days can be obtained by multiplying the rooms available by 1,000 and dividing it by the number of rooms.
5. Updates
Data for 2023 was updated on August 1, 2024, and will be updated at the end of March each year afterwards. In other words, at least one update of annual timeseries data occurs per subscription period.
From 4th quarter of 2024, items related to floor area of establishments will be added to the supply data as well. The establishment area will be provided together with a break-down into room facility area, other facility area, and public facility area.
The establishment level data will be provided separately at Lobin Dashboard, a Web App currently under development, together with contents of the current member dashboard. The existing users of the member dashboard can choose to transfer to Lobin Dashboard, before the launch of Lobin Dashboard, and a separate email will be sent in advance.