If you look at the statutory classification system, you will recognize that the lodging business is defined more broadly than the lodging property. According to the Korean Standard Industrial Classification, the categories of lodging include hotels, vacation condominiums, inns, bed and breakfasts, other general and living accommodations, dormitories and boarding houses, and other lodging businesses. However, according to the Enforcement Decree of the Building Code, facilities used for bed and breakfast are single-family houses and facilities used for dormitory operations are multi-family houses, which are not included in the category of accommodation. This article looks into the lodging property as a commercial real estate, used exclusively for lodging business.
The lodging property as a commercial real estate is intended to generate cash flows by a lodging business. It should be noted, however, that the lodging property is not all to do so, while it accounts for the largest portion. There needs to be the value chain, a mechanism to generate actual cash flows, as well as the working capital which makes the value chain work. In other words, the intangible and current assets must be in place, in addition to tangible assets, in order for the property to function as intended. The evaluation of a lodging property, in the context of commercial real estate transactions, means an evaluation of total assets required for lodging business at the property level. At the end of the day, it is the cash flow generated at the property that is evaluated.
1. Opportunity Costs and Implied Cap Rates
Buying the right to future cash flows in the present is called an “investment”. And the liquidation of these rights into a form that can be conveniently traded is an “investment product.” Traditionally, stocks, bonds, and real estates have been the representative investment products, while derivatives based on various financial techniques have been developed as alternatives, and blockchain-based cryptocurrencies have recently emerged as a new option.
Generally, the investment decisions are made based on expected future cash flows. Future cash flows are composed of dividends and capital gains, each with different volatility. The mix between dividends and capital gains differs by product, and, therefore, the risk profile of each investment product is different. The present value of an investment product is determined by discounting the expected future cash flows through a discount rate.
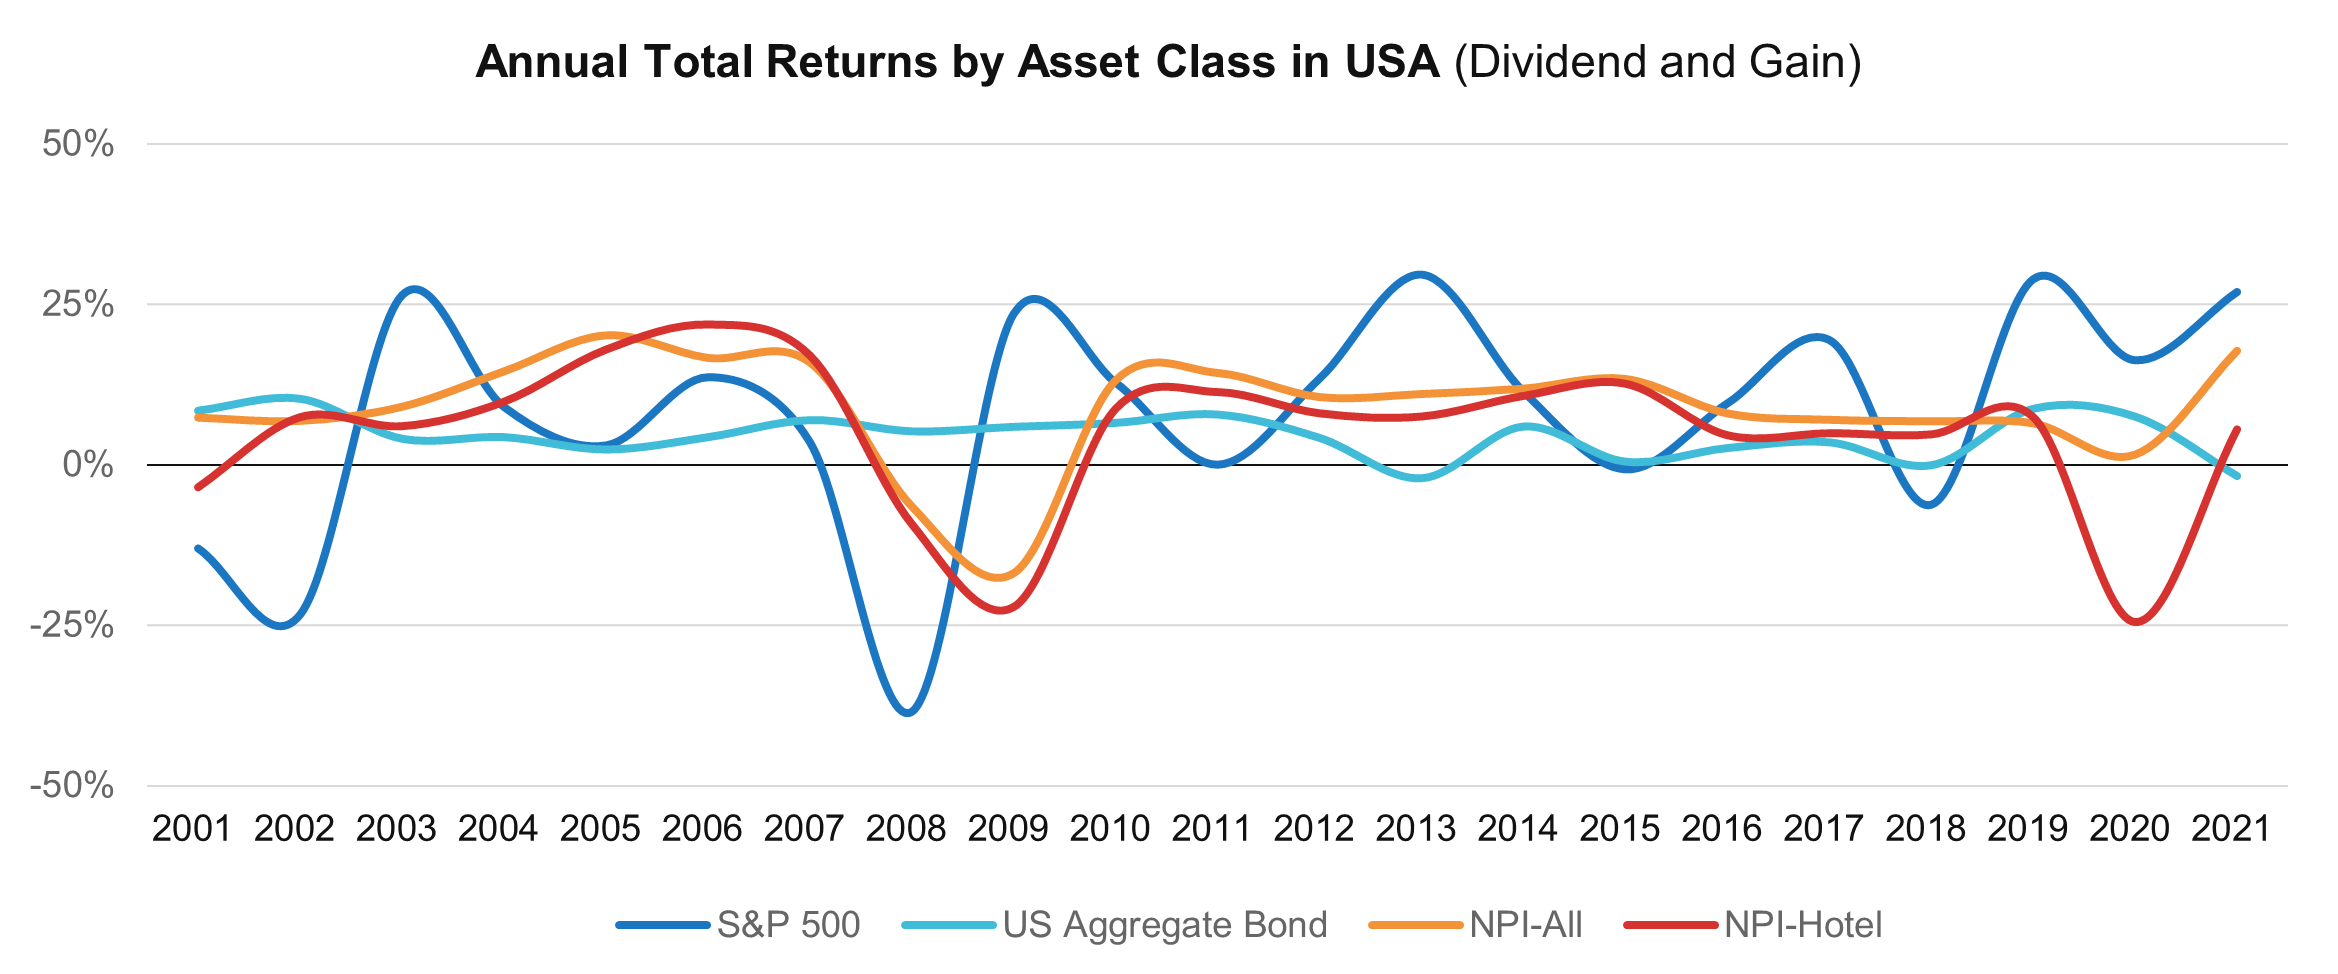
The selection of an investment product means that the other options are discarded, incurring opportunity costs. As such, the decision needs to be made in consideration of opportunity costs. From 2001 to 2021, the average annual return on major investment products in the United States were 9.0% for real estate, 7.9% for stocks, 5.1% for hotels and 4.6% for bonds. The volatilities, measured by standard deviation, were 8.4% for real estate, 17.5% for stocks, 12.0% for hotels and 3.4% for bonds. The annual return here means a total return including dividends and capital gains.

The capitalization rate is a discount rate used to determine the value of a commercial real estate, such as a lodging property, and is calculated by dividing the net operating income by the transaction price of the property. The net operating income is a profit generated at the property, which does not take into account of non-operating income such as capital gain, or non-operating expense such as interest expense. In other words, the capitalization can be interpreted as a weighted average rate of “dividend” return for equities and debts combined, as it is calculated as cash flows only from operations divided by the sum of equities and debts.
If you want to transact a commercial real estate property, you can quickly estimate the value by dividing the net operating income of the property by the capitalization rate used in similar transactions. The capitalization rate is widely used in commercial real estate transactions because of simplicity of calculations, while is it available only if there are enough cases and data of similar transactions. On the other hand, if there are not enough transaction cases or data, the use of capitalization rate will be limited.
2. Cap Rate of Offices and Lodging Properties
If there are not enough transaction cases or data available, an implied capitalization rate can be used as an alternative. The implied capitalization rate can be derived in two ways: First, a relative risk premium is added to the risk-free rate of return. Second, a relative risk premium is added to or subtracted from the capitalization rate of properties with enough transaction cases and data. Technically, the risk premium can be derived by comparing the volatility in cash flows from operation, by measuring standard deviation.
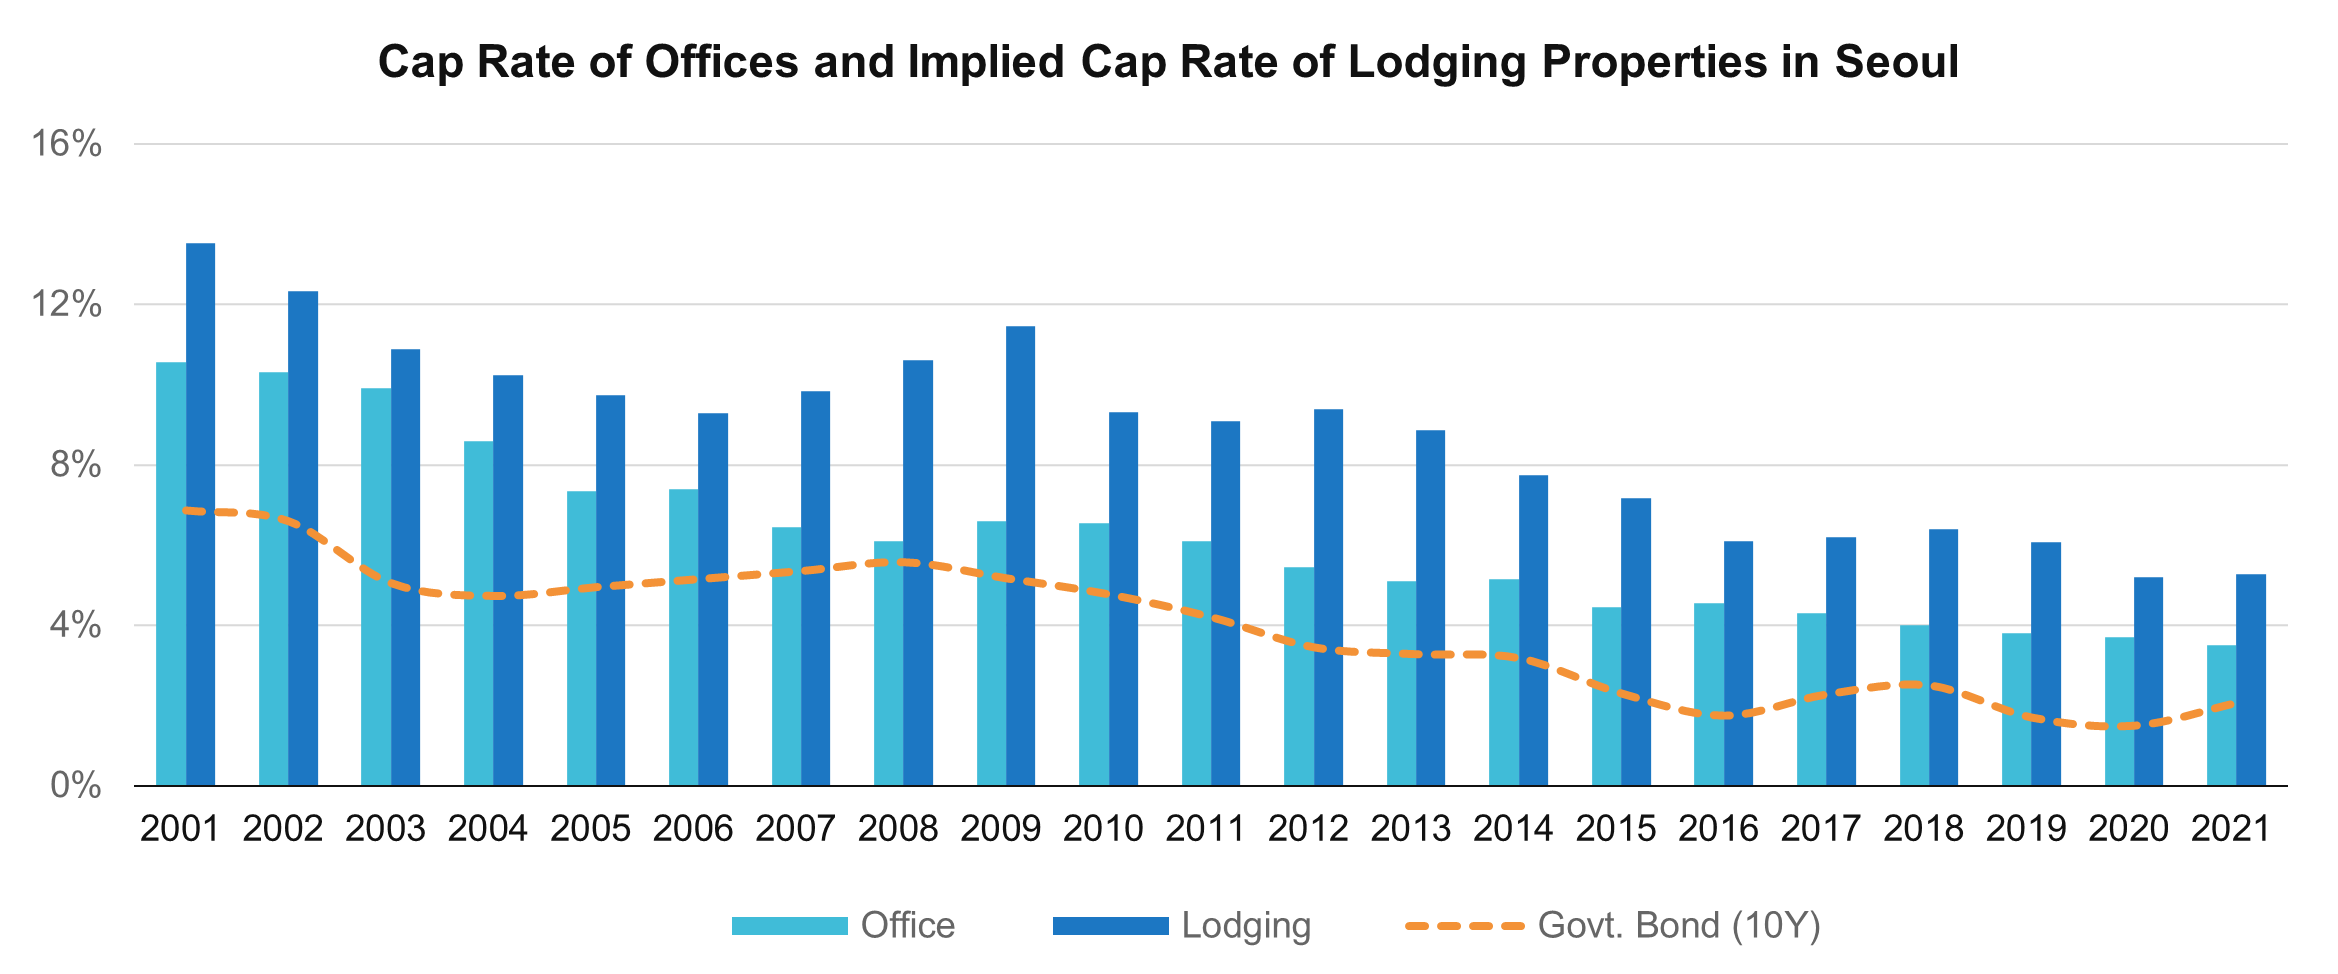
The most widely used risk-free rate of return in Korea is the 10-year government bond yield, which was 3.9% on average per annum from 2001 to 2021. Meanwhile, the offices in Seoul provide the most transaction cases and data, among commercial real estate properties in Korea. According to data collected by IGIS Asset Management, the capitalization rate for offices in Seoul was 6.2% on average per annum from 2001 to 2021. Considering the volatility of cash flows of offices in Seoul, the risk premium over the 10-year government bond was around 2.3%.

The volatility in cash flows of lodging properties is much larger than offices. It is even more so in in Seoul, as the international demand accounts for the majority, which is highly sensitive to exchange rates. Lobin estimated the risk premium of lodging properties from 2001 to 2021 through a regression-based algorithm, using cash flows of lodging properties and offices in Seoul, as well as the 10-year government bond yield, as independent variables.
The implied capitalization rate for lodging properties in Seoul was 8.8% on average per annum from 2001 to 2021, implying a risk premium of 2.6% over the offices in Seoul and 4.9% over the 10-year government bond yield. The risk premium over the offices was the highest at 4.9% in 2009 and the lowest at 1.0% in 2003. It is interesting to note that room revenue per available room declined sharply in 2003 right after the Korea-Japan World Cup, while it began to bounce back in 2009 due to the Korean Wave across Asia. In other words, the risk premium of lodging properties tends to move in the opposite direction of the lodging market. It seems like true as the risk premium of lodging properties over the offices remained at the late 3% until 2012, when the lodging market continued to boom, but tightened to the middle of 1% since 2016, when the lodging market continued to struggle with internal and external troubles.
3. Implied Cap Rates by Lodging Property Type
Lodging properties can be broken down to segments, each with different attributes and levels of risk. 5-star hotels typically have high entry barriers because of the size of facilities and the range of amenities, bringing down the level of risks associated with changes in competitive environment. However, it is extremely complicated to measure the risk levels, as there exists a huge difference in the volatility of cash flows between room and non-room operations. On the other hand, motels with room-focused operation have relatively simple cash flows, but the competitive environment may fluctuate as new supplies can increase quickly.

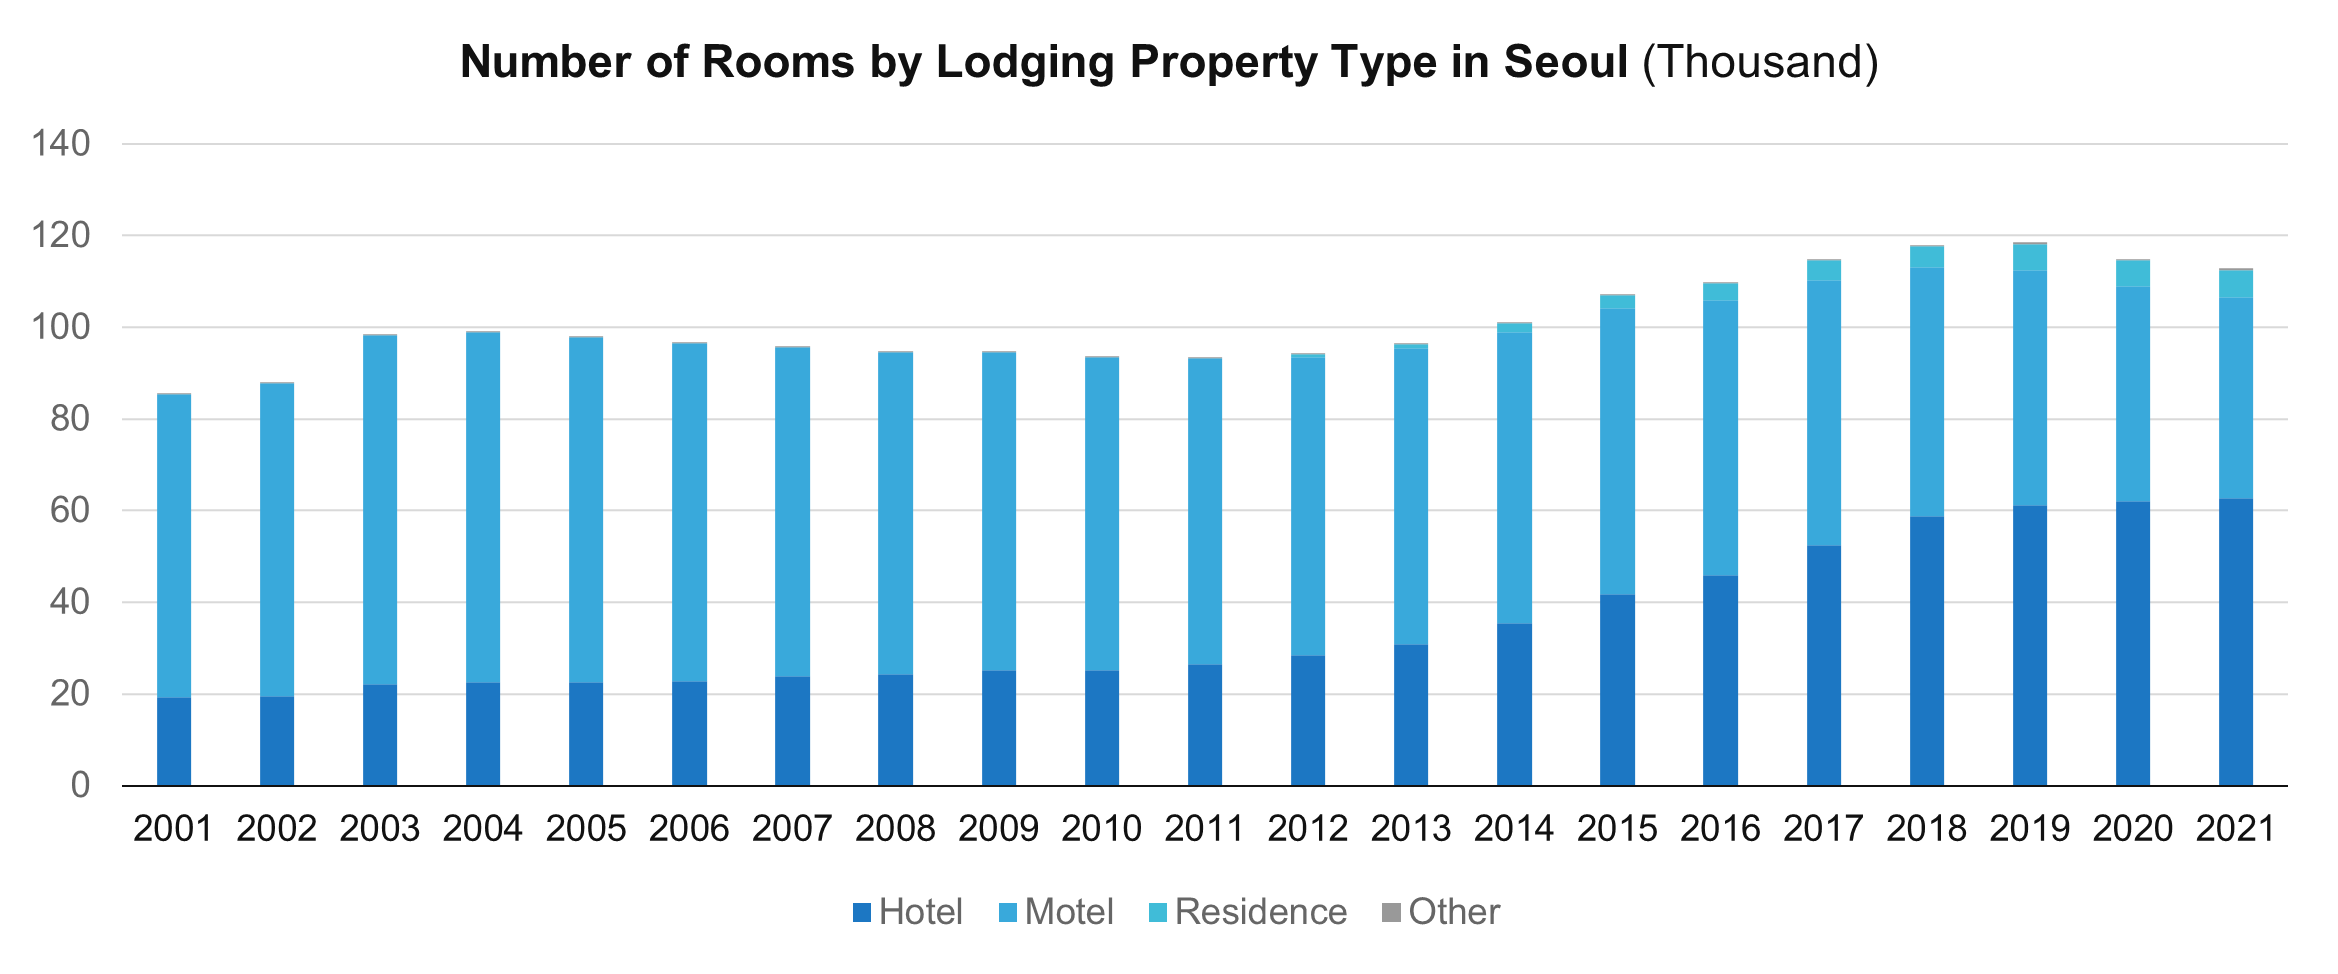
Hotels and so-called motels account for more than 95% of the total number of rooms in Seoul. It would be worthwhile to note that the share of motel rooms, which accounted for more than 70% until 2012, has decreased to 40% by 2021, while the share of hotel rooms, which accounted for less than 30% until 2012, has increased to 55% by 2021. The rapid increase in hotel rooms has led to a drastic change in the competitive environment, and many motels were not able to survive it. Anyways, the fact that the risks from low entry barriers are prominent in motels still seems to remain valid.
In order to accurately estimate the risk premium of lodging properties by type, it is necessary to consider the risk associated with entry barriers and supply increase, in addition to the volatility of cash flows. Lobin estimated the risk premium of lodging properties by type in Seoul from 2001 to 2021 through a regression-based algorithm using the replacement costs and the volatility of cash flows, as well as the capitalization rate for the entire lodging properties, as independent variables.

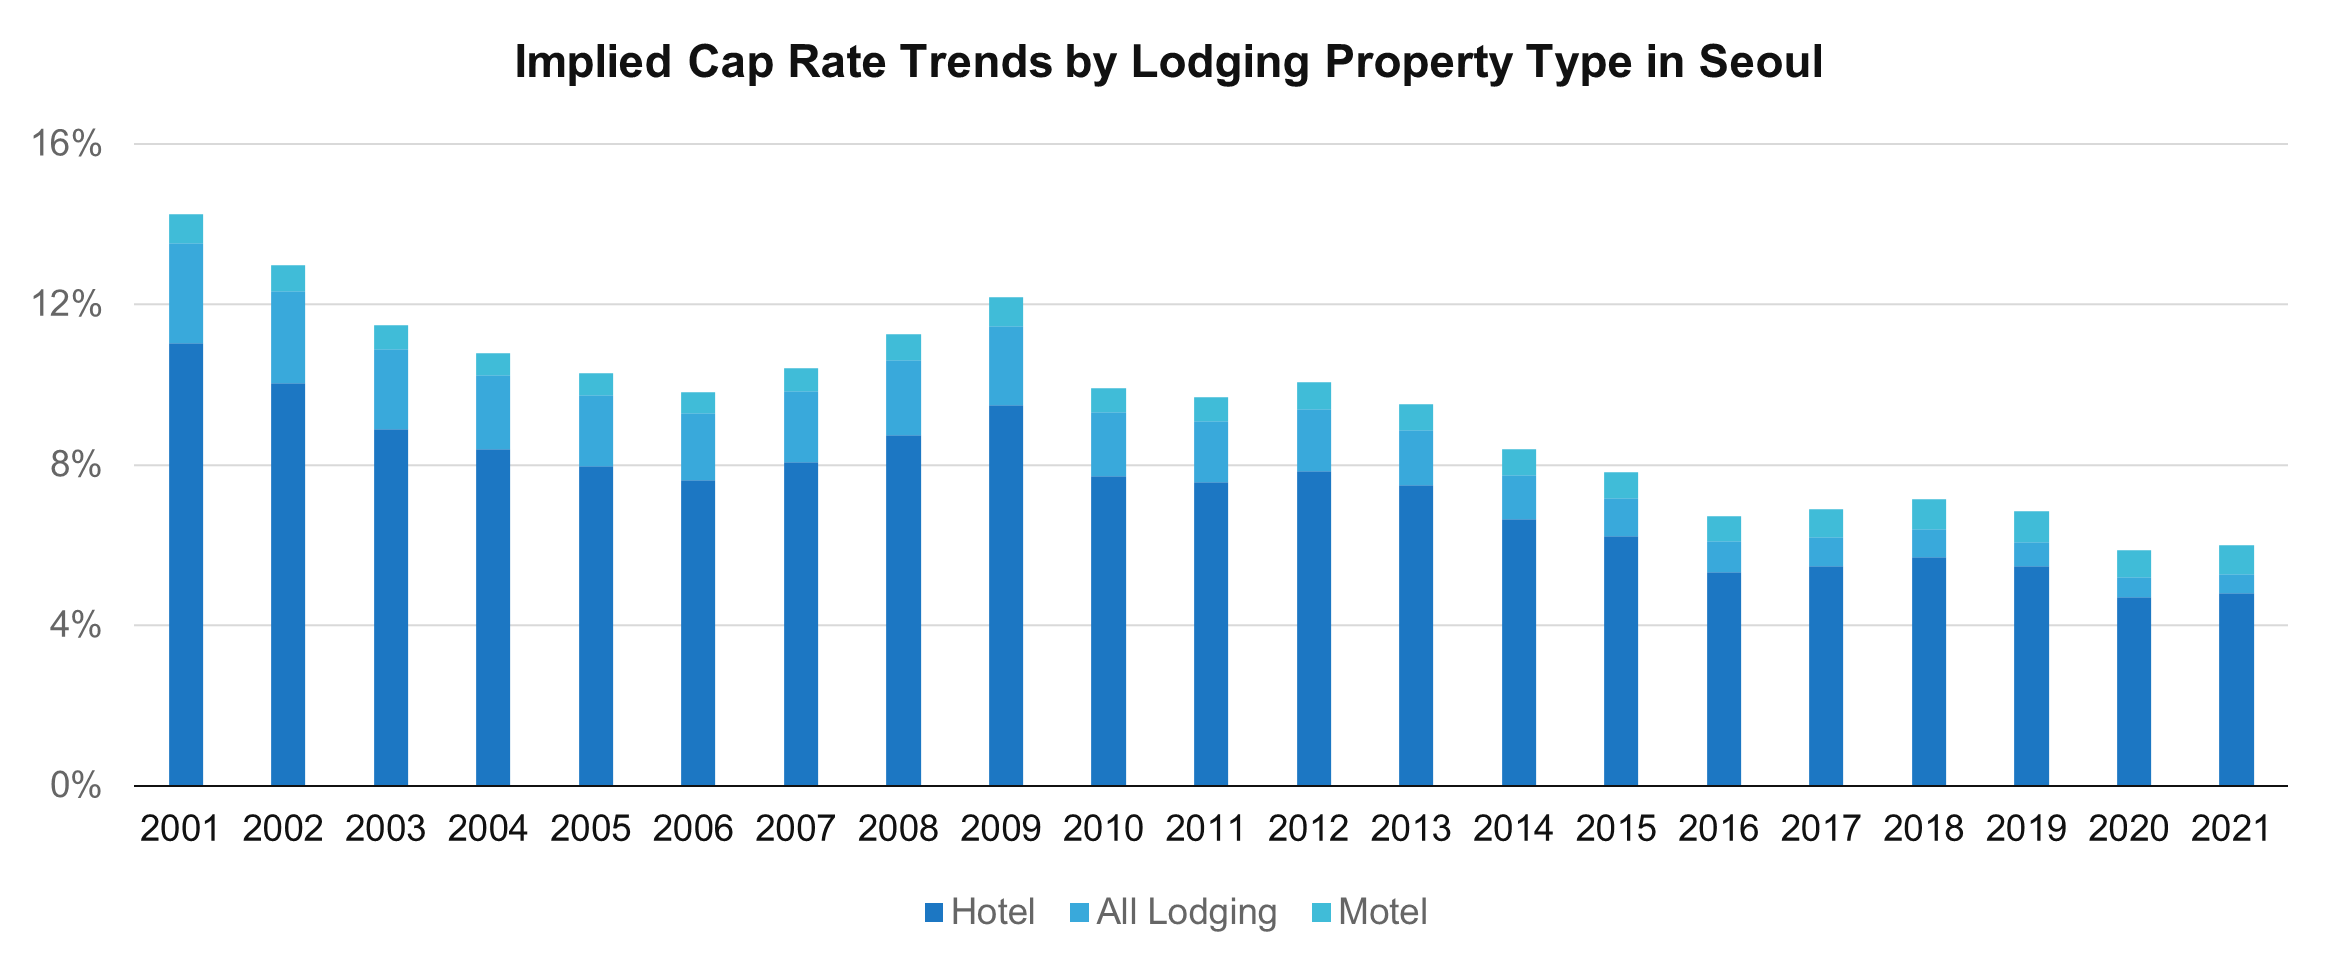
In 2001, the capitalization rate was 13.5% for the entire lodging properties in Seoul, 11.0% for hotels and 14.2% for motels. In 2021, it changed to 5.3% for the entire lodging properties in Seoul, 4.8% for hotels and 6.0% for motels. While the gap between hotels and the entire lodging properties narrowed down significantly, the gap between motels and the entire lodging properties has remained almost unchanged. The main reason is believed to be the increased share of hotels in the market-wide capitalization rate as the supply of hotel rooms increased significantly.
4. Pros and Cons of Implied Cap Rates
The capitalization rate is useful as a measure to evaluate the values of a commercial real estates based on cash flows. This is especially true in that it is the fastest and easiest way to identify the income value. However, since it is based on the cash flows at a single point in time, the income value derived through capitalization rate is not self-explanatory, especially for lodging properties with highly volatile cash flows. This is because the value of assets can be distorted subject to timing of evaluation. Therefore, it would be better to take it as one of the various valuation measures.
In addition, the implied capitalization rate provides an initial guideline for income values for lodging properties in Korea, as there are not many transactions. In particular, it provides an advantage to compare opportunity costs across investment products. However, since it is not based on actual transaction data, the results may vary depending on the data referred. Therefore, it would be necessary to verify accuracy of the reference data, size of the reference sample and statistical significance demonstrateed, before making decisions based out of it.

