1. Hotel Markets in 2020, Swept by COVID-19
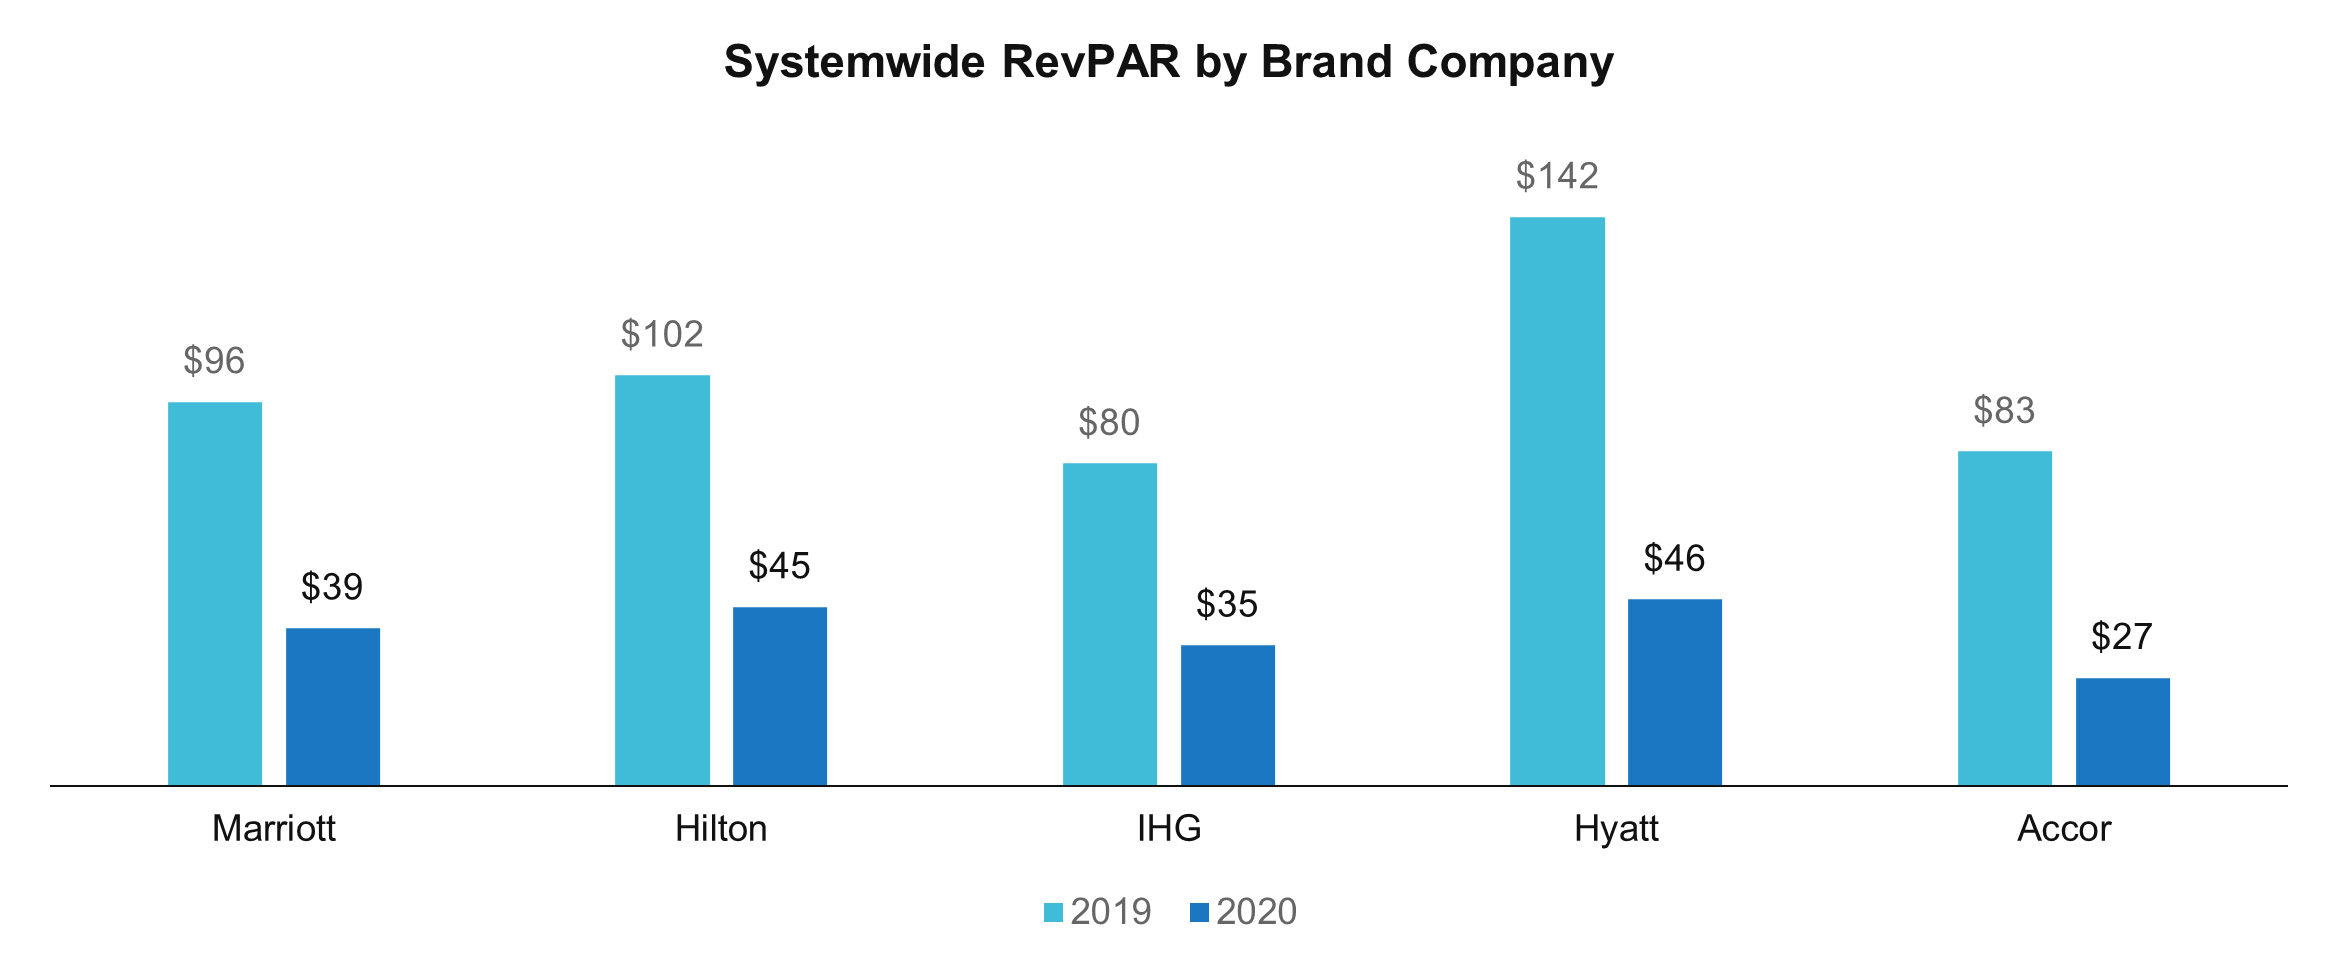
Systemwide in 2020 vs. 20191 RevPAR, Marriott saw a decrease of 59.0%, Hilton saw a decrease of 56.5%, IHG saw a decrease of 56.4%, Hyatt saw a decrease of 67.3%, and Accor saw a decrease of 67.7%. The consolidated results of these five listed global brand companies show that Systemwide RevPAR in 2020 decreased by 60.5% compared to 2019. Hyatt and Accor saw a larger decline than average, and the impact of Accor, which is relatively large in its portfolio, must have been greater than Hyatt.
2. Americas Holding Up Relatively Well
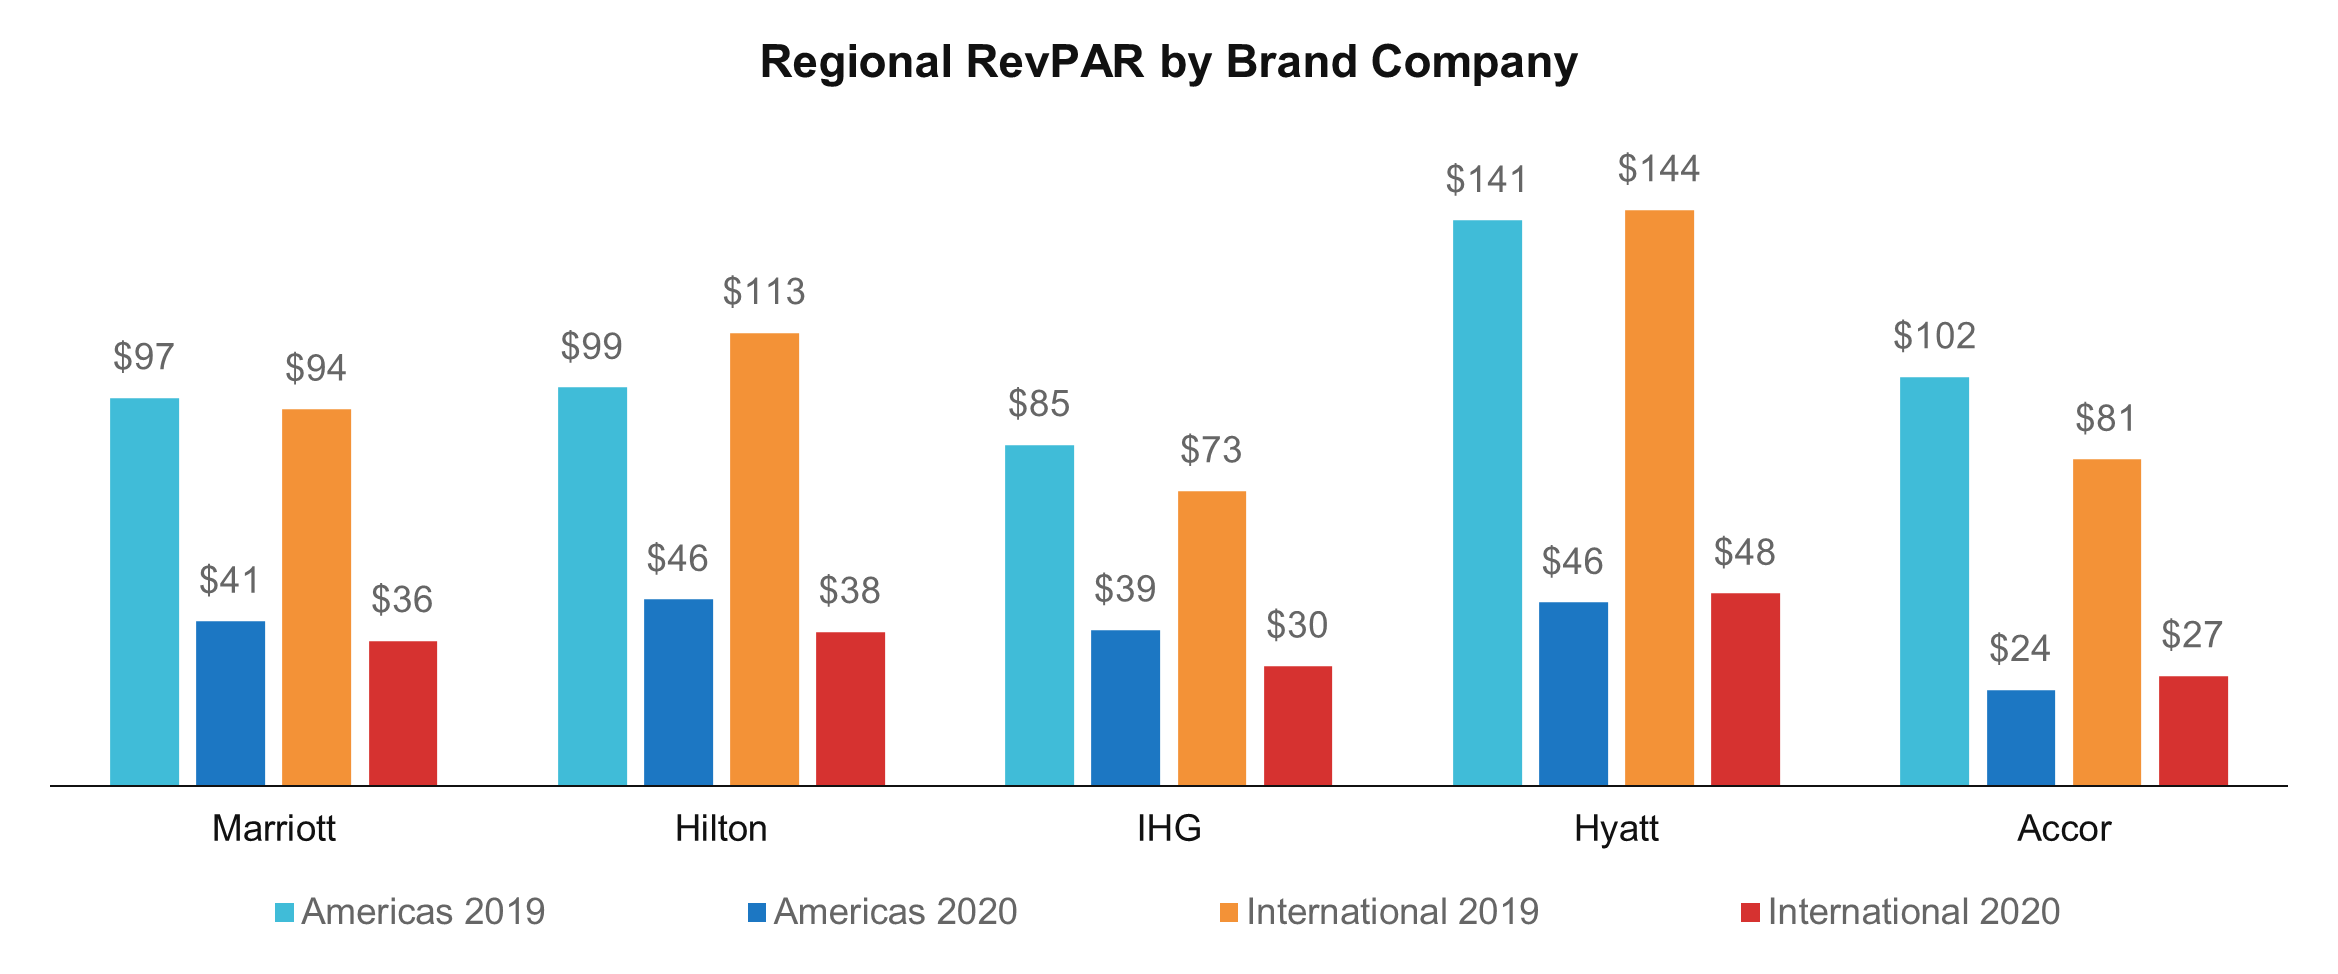
In Marriott’s case, the Americas region declined 57.7% and the Non-Americas region saw a slightly higher decline of 61.5%. In Hilton, the decline in Non-Americas region stood out at 66.0% compared to 53.3% in the Americas region, and in IHG, like Marriott, 59.5% in the Non-Americas region, slightly higher than 54.4% in the Americas region. In the case of Hyatt, the decline in the Americas region and the Non-Americas region was close, with 67.6% and 66.6% respectively, while in Europe-based Accor, the decline in the Americas region was 76.6% compared to 66.4% in the Non-Americas region. Based on the number of rooms, the Americas region accounted for 58.2% for Marriott, 77.1% for Hilton, 58.0% for IHG, 66.2% for Hyatt and 13.2% for Accor. In other words, while Hilton’s bias towards the Americas region and Accor’s bias towards the Non-Americas region were notable, Marriott, IHG, and Hyatt showed little difference in their portfolio mix.
3. Life Style Down, Extended Stay Up
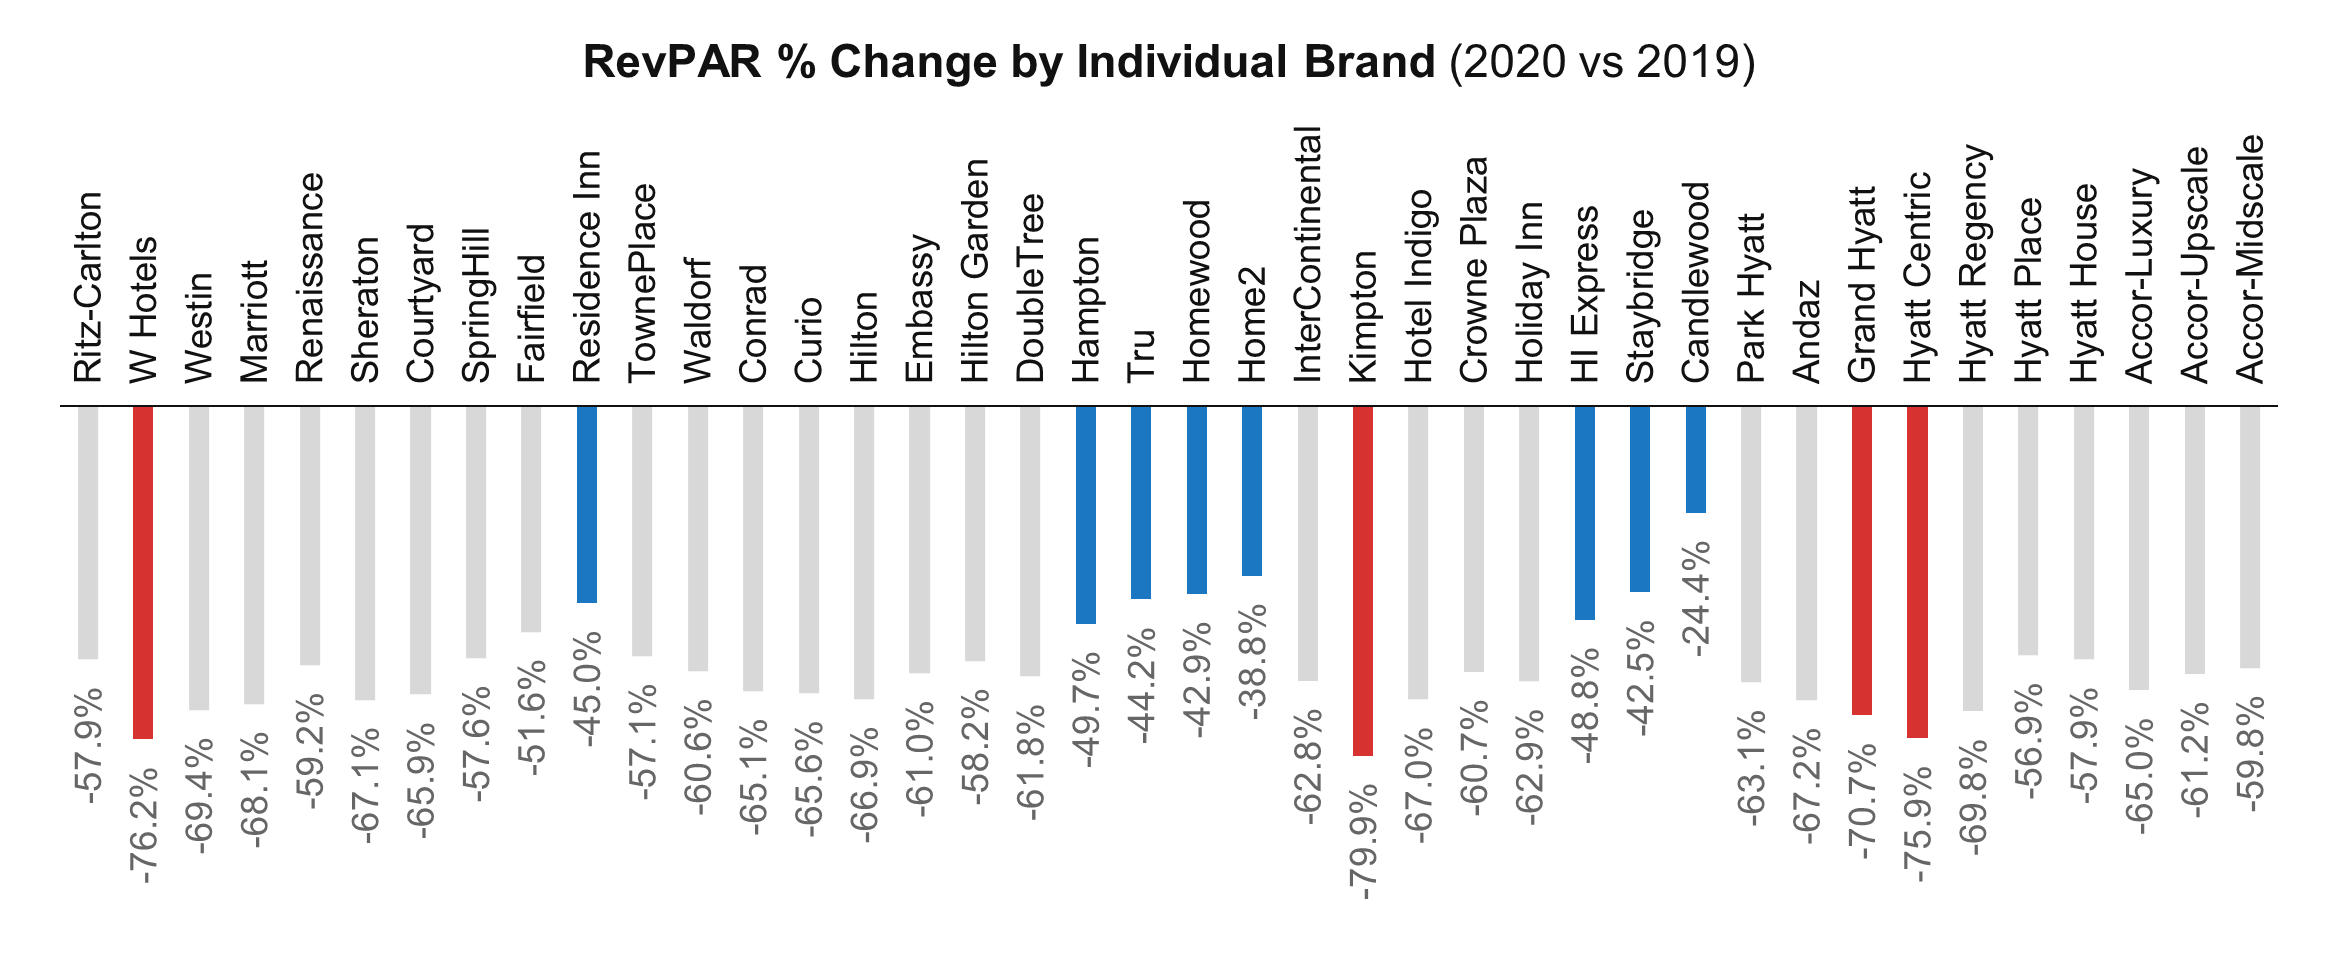
In Marriott’s case, W showed the biggest drop of 76.2%, while Residence Inn held up relatively well at 45.0%. In Hilton, Hilton had the biggest drop of 66.9%, while Home2 had the best lead at 38.8%. In IHG, Kimpton saw the largest drop among all the brands in question at 79.9%, while Candlewood saw the smallest drop at 24.4%. In the case of Hyatt and Accor, the performance was quite disappointing across their brands, and Hyatt seemed to suffer the most as Grand Hyatt and Hyatt Centric decreased by more than 70% at the same time, coupled with a small portfolio and a high proportion of life-style brands.
4. COVID-19 and Stock Prices of Global Brands
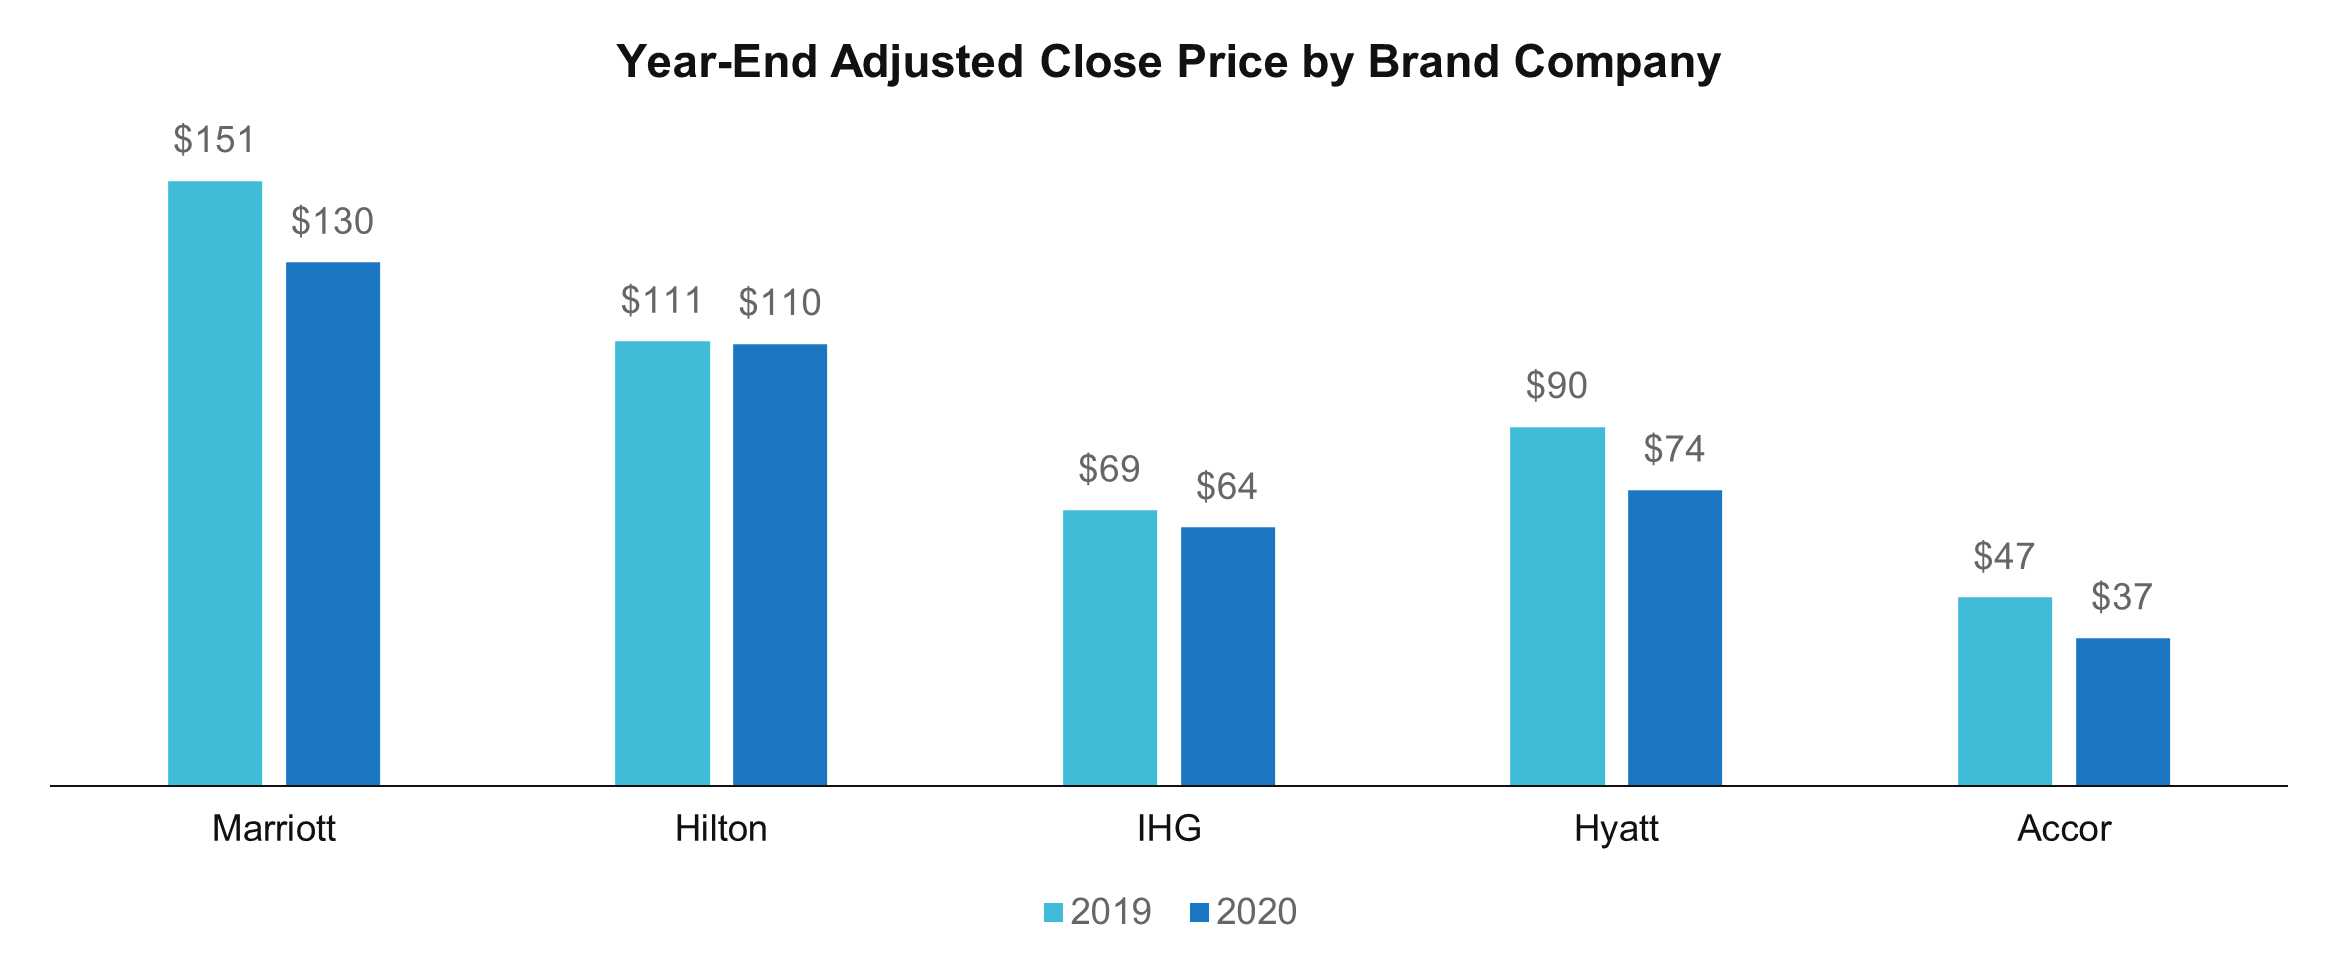
Looking into the adjusted close price at the end of 2020 compared to the end of 2019, Marriott declined by 13.5% from &151 to $130 and IHG by 6.3% from $69 to $64, while Hilton was not so much impacted at 0.5% from $111 to $110. On the other hand, Hyatt and Accor seemed to be hit significantly by COVID-19, declined 17.7% from $90 to $74 and 21.5% from $47 to $37, respectively. The revenues of global hotel brands are tied to the revenues of their hotels, and therefore, their revenue streams are not free from hotel market conditions. However, most of them held up relatively well in share prices, compared to the circumstances in the hotel market. There seem to be several reasons.
5. Expansion of Portfolio Helped
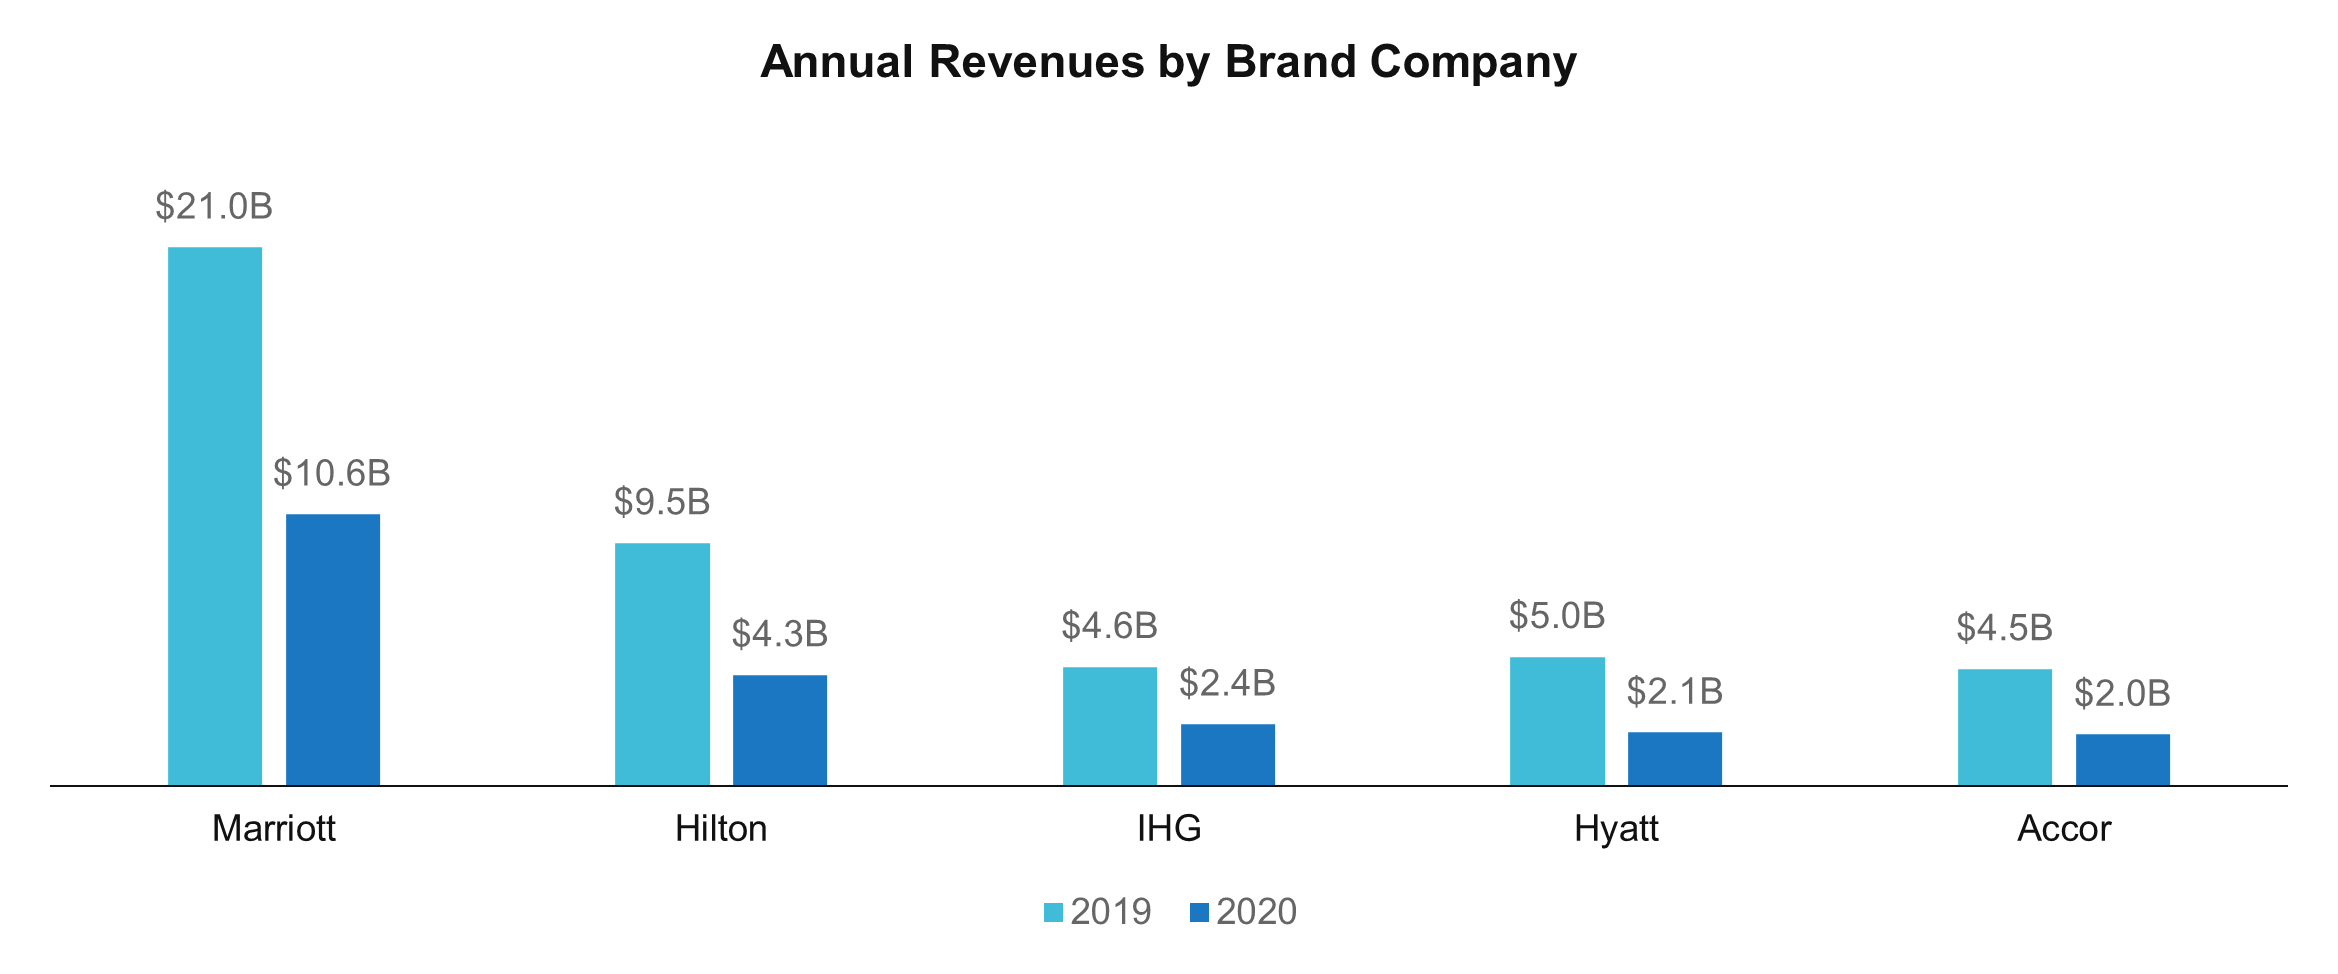
Marriott’s revenues fell by 49.6% while its RevPAR fell by 59.0% and Hilton’s revenues fell by 54.4% while its RevPAR fell by 56.5%. IHG’s revenues fell by 48.3% while its RevPAR fell 56.4%, Hyatt’s revenues fell by 58.8% while its RevPAR fell by 67.3%, and Accor’s revenues fell by 56.2% while its RevPAR fell by 67.7%. Most companies except Hilton found that the decrease in revenues was about 10% lower than the decrease in RevPAR. The biggest reason is that the global brand’s hotel portfolio has continued to grow in 2020. By room count, Marriott grew by 1.8%, Hilton by 4.8%, IHG by 0.3% Hyatt by 10.1% and Accor by 2.0%. In other words, although the revenues from individual hotels decreased, the company’s revenues were relatively less affected as the number of hotels generating such revenues increased.
6. Cost Elasticity Proportionate to Portfolio Size
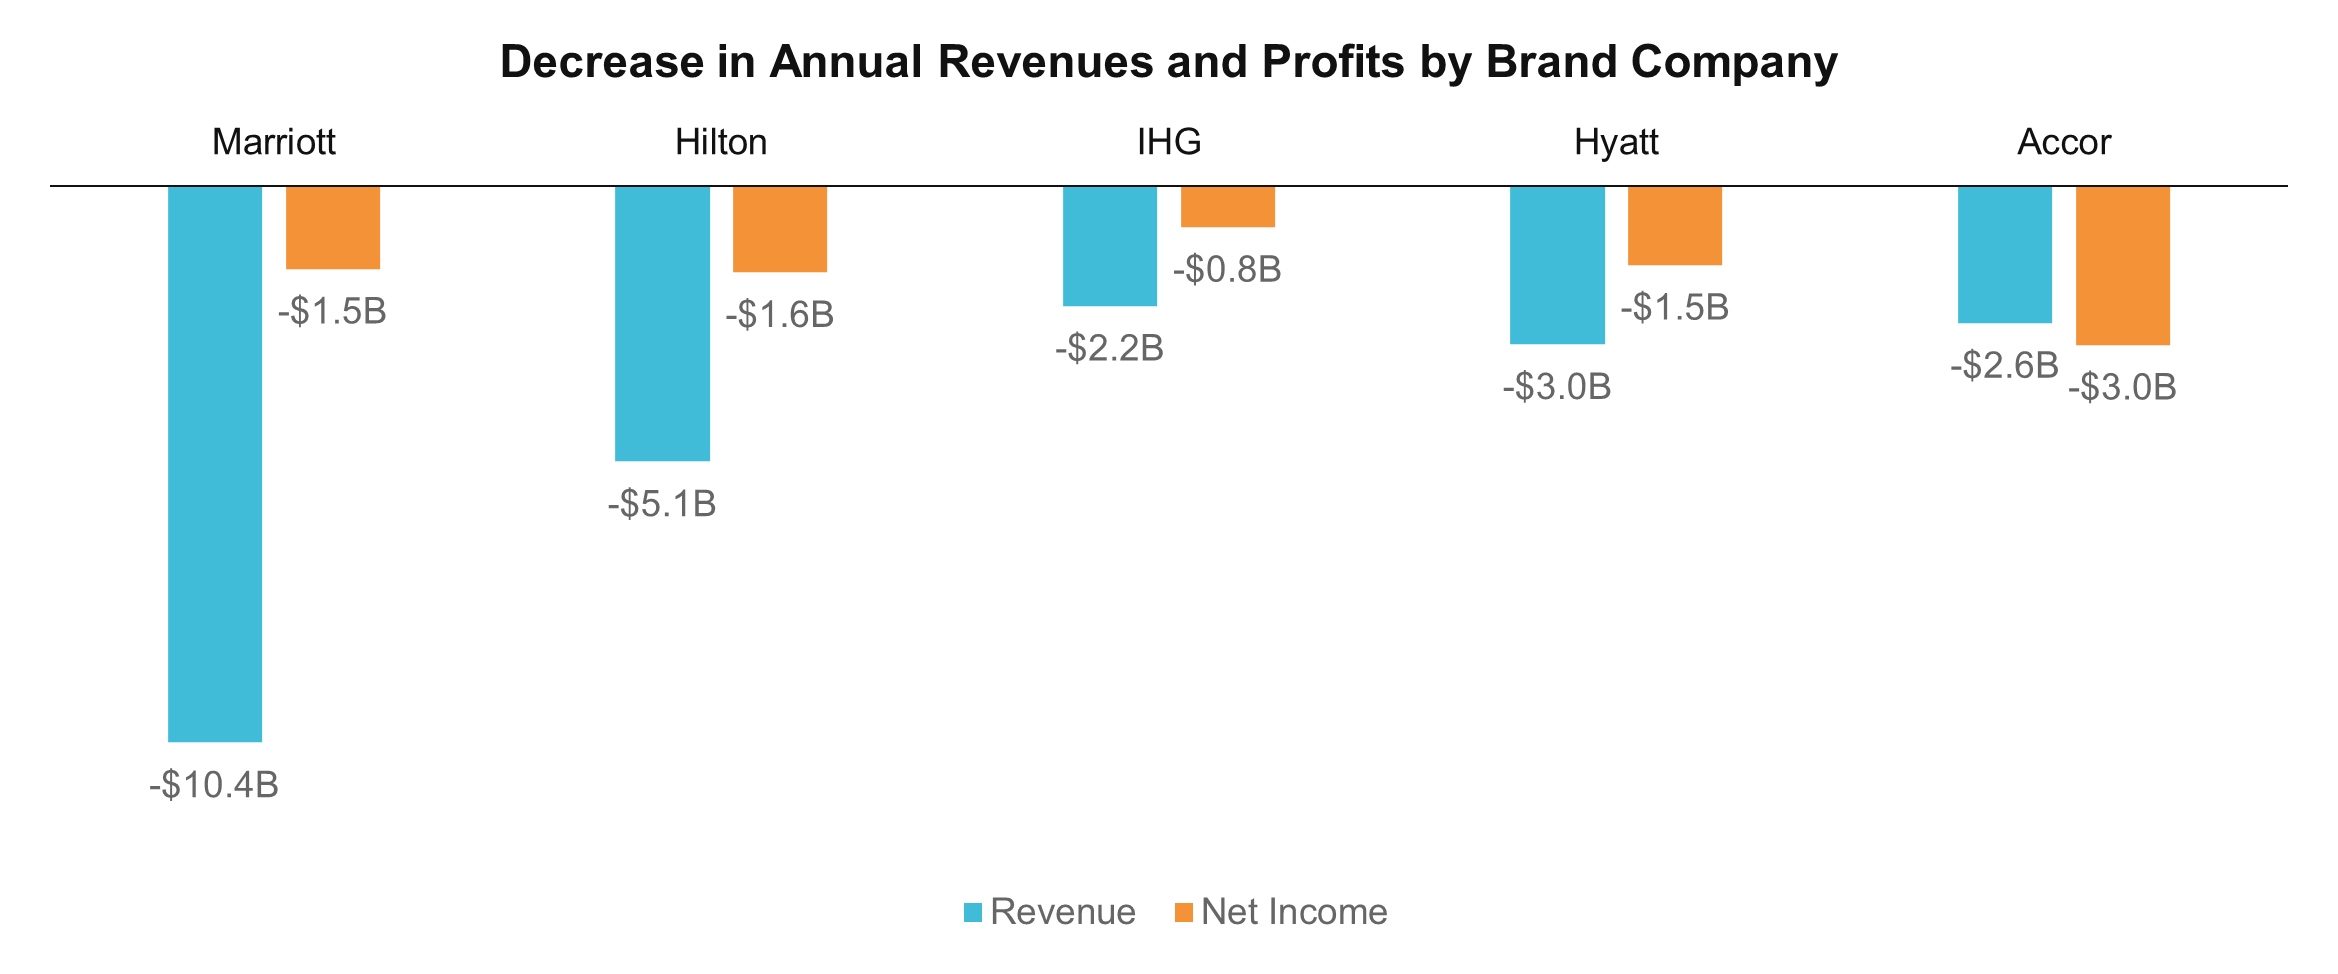
Looking at the ratio of decrease in net income to the decrease in revenues in 2020, Marriott was 14.8%, Hilton was 31.2%, IHG was 34.0% and Hyatt was 49.7%. However, in the case of Accor, the decrease in net income exceeded the decrease in revenues at 115.9%, which still seems absorbable considering the size of its capital stack. Of course, none of the companies actually recorded ‘net income’, but ‘net loss’, in 2020, but most of them seemed to have prevented the impact of the revenue decline flow through to the profit through an effective cost management. The size of the portfolio seemed to help here, thanks to the economies of scale. The 2020 annual report showed that Marriott had 1.64 million rooms, Hilton had 101 million rooms, IHG had 890 thousand rooms, Hyatt had 230 thousand rooms, and Accor had 750 thousand rooms.
7. Global Brand Absorbing Market Liquidity
In the hotel industry, where cyclical fluctuations exist all the time, it seems like a common viewpoint to perceive this time as a trough. In addition, based upon past experiences, many people seem to think that there will be a rapid growth behind it. However, since the destructive power of COVID-19 can still knock down any hotel or company in the short term, the capital market seems to focus on these big players with already secured economies of scale. In particular, Hilton may have benefited from its bias towards the Americas region in its portfolio, with an expectation for global expansion after COVID-19. As mentioned earlier, the portion of the Americas region in Hilton’s portfolio at the end of 2020 was 77.1%, larger than its peers.

We don’t know yet when and how the COVID-19 situation will end, and we don’t even know what’s waiting for us at the end of that long tunnel. But as the bright sun rises back at the end of a dark night, there will surely come a day when we will have joke around this time. On the other hand, this dynamic ups-and-downs reaffirms the importance of data. Even in situations that we cannot quite follow and digest, there are cases we finally figure out how it worked as we go through the records later. Once we get there, they tell us a lot of stories. One thing clear in this uncertain times is that the more we listen to the story, the less frequent the recurrence of the same mistakes.

